Salesforce.com 2006 Annual Report Download - page 74
Download and view the complete annual report
Please find page 74 of the 2006 Salesforce.com annual report below. You can navigate through the pages in the report by either clicking on the pages listed below, or by using the keyword search tool below to find specific information within the annual report.-
 1
1 -
2
-
3
-
4
-
5
-
6
-
7
-
8
-
9
-
10
-
11
-
12
-
13
-
14
-
15
-
16
-
17
-
18
-
19
-
20
-
21
-
22
-
23
-
24
-
25
-
26
-
27
-
28
-
29
-
30
-
31
-
32
-
33
-
34
-
35
-
36
-
37
-
38
-
39
-
40
-
41
-
42
-
43
-
44
-
45
-
46
-
47
-
48
-
49
-
50
-
51
-
52
-
53
-
54
-
55
-
56
-
57
-
58
-
59
-
60
-
61
-
62
-
63
-
 64
64 -
 65
65 -
 66
66 -
 67
67 -
 68
68 -
 69
69 -
 70
70 -
 71
71 -
 72
72 -
 73
73 -
 74
74 -
 75
75 -
 76
76 -
 77
77 -
 78
78 -
 79
79 -
 80
80 -
 81
81 -
 82
82 -
 83
83 -
 84
84 -
85
-
86
-
87
-
88
-
89
-
90
-
91
-
92
-
93
-
94
-
95
-
96
-
97
-
98
-
99
-
100
-
101
-
102
-
103
-
104
-
105
-
106
-
107
-
108
-
109
-
110
-
111
-
112
-
113
-
114
-
115
-
116
-
117
-
118
-
119
-
120
-
121
-
122
-
123
-
124
 |
 |
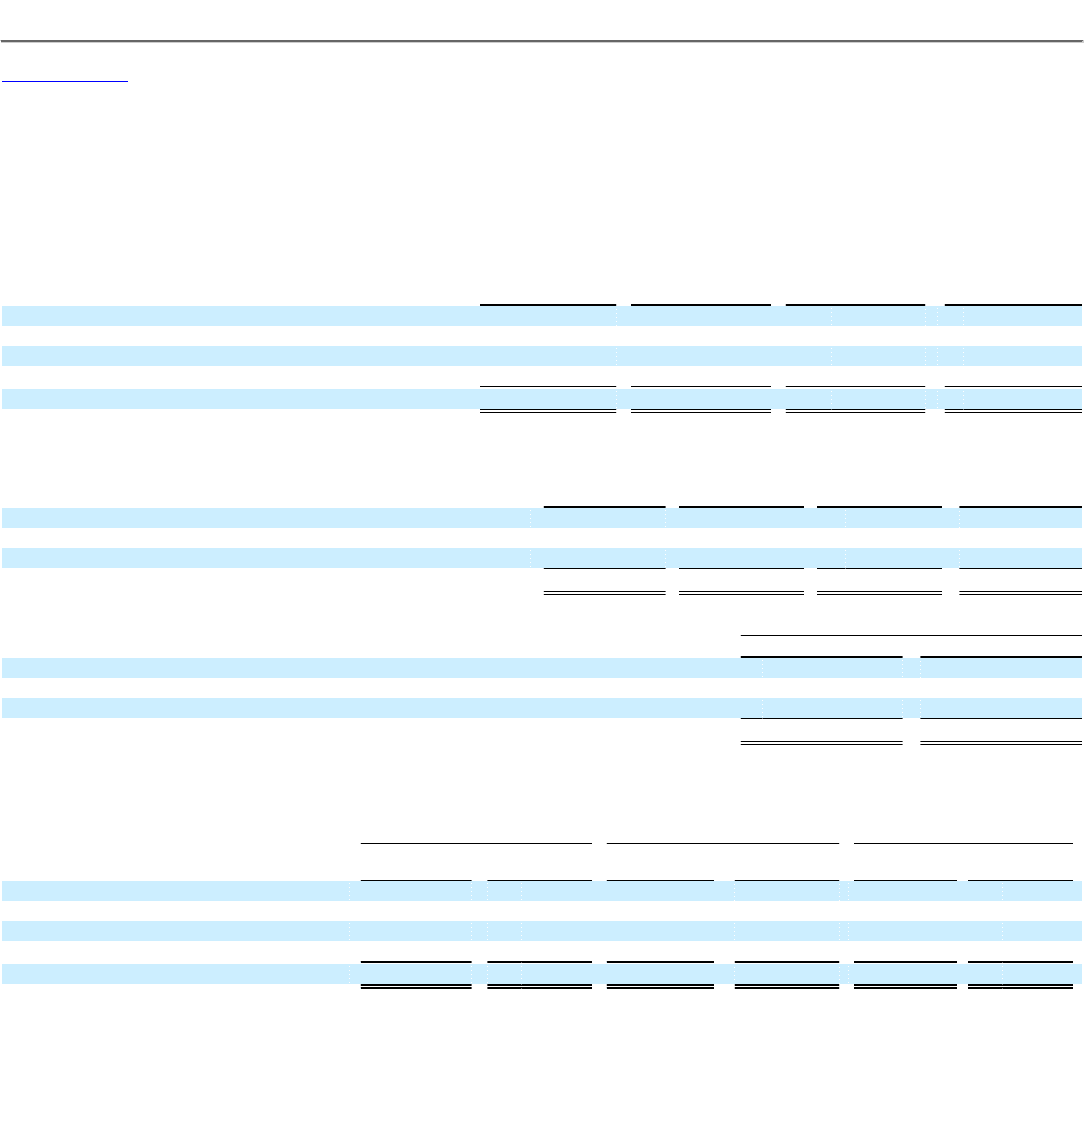
Table of Contents
salesforce.com, inc.
Notes to Consolidated Financial Statements—(Continued)
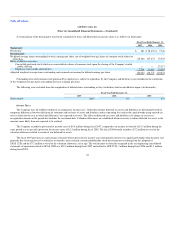
4. Balance Sheet Accounts
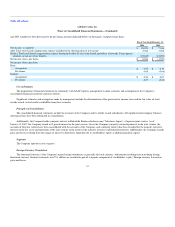
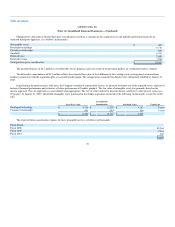
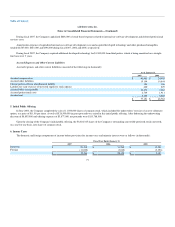
Marketable Securities
At January 31, 2007, marketable securities consisted of the following (in thousands):
Amortized
Cost
Unrealized
Gains
Unrealized
Losses Fair Value
Corporate notes and obligations $ 156,826 $ 9 $ (402) $ 156,433
Municipal bonds 1,974 — (17) 1,957
U.S. treasury securities 30,805 — (215) 30,590
U.S. agency obligations 137,107 5 (188) 136,924
$ 326,712 $ 14 $ (822) $ 325,904
At January 31, 2006, marketable securities consisted of the following (in thousands):
Amortized
Cost
Unrealized
Gains
Unrealized
Losses Fair Value
Corporate notes and obligations $ 98,686 $ — $ (749) $ 97,937
Municipal bonds 1,915 — (52) 1,863
U.S. government and agency obligations 97,917 4 (771) 97,150
$ 198,518 $ 4 $ (1,572) $ 196,950
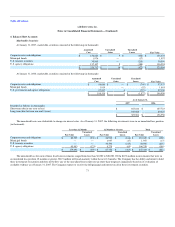
As of January 31,
2007 2006
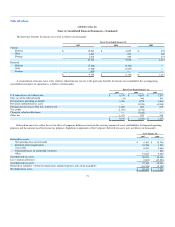
Recorded as follows (in thousands):
Short-term (due in one year or less) $ 165,816 $ 107,723
Long-term (due between one and 3 years) 160,088 89,227
$ 325,904 $ 196,950
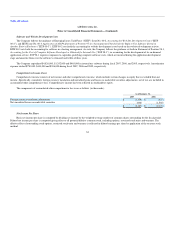
The unrealized losses are attributable to changes in interest rates. As of January 31, 2007, the following investments were in an unrealized loss position
(in thousands):
Less than 12 Months 12 Months or Greater Total
Fair Value
Unrealized
Losses Fair Value
Unrealized
Losses Fair Value
Unrealized
Losses
Corporate notes and obligations $ 83,709 $ (236) $ 26,930 $ (166) $ 110,639 $ (402)
Municipal bonds — — 1,957 (17) 1,957 (17)
U.S. treasury securities — — 30,590 (215) 30,590 (215)
U.S. agency obligations 95,983 (123) 8,275 (65) 104,258 (188)
$ 179,692 $ (359) $ 67,752 $ (463) $ 247,444 $ (822)
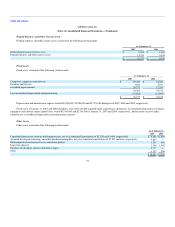
The unrealized loss for each of these fixed rate investments ranged from less than $1,000 to $38,000. Of the $67.8 million in investments that were in
an unrealized loss position 12 months or greater, $56.9 million will reach maturity within the next 12 months. The Company has the ability and intent to hold
these investments to maturity and does not believe any of the unrealized losses represent an other-than-temporary impairment based on its evaluation of
available evidence as of January 31, 2007. The Company expects to receive the full principal and interest on all of these investment securities.
71