Salesforce.com 2006 Annual Report Download - page 45
Download and view the complete annual report
Please find page 45 of the 2006 Salesforce.com annual report below. You can navigate through the pages in the report by either clicking on the pages listed below, or by using the keyword search tool below to find specific information within the annual report.-
 1
1 -
2
-
3
-
4
-
5
-
6
-
7
-
8
-
9
-
10
-
11
-
12
-
13
-
14
-
15
-
16
-
17
-
18
-
19
-
20
-
21
-
22
-
23
-
24
-
25
-
26
-
27
-
28
-
29
-
30
-
31
-
32
-
33
-
34
-
 35
35 -
 36
36 -
 37
37 -
 38
38 -
 39
39 -
 40
40 -
 41
41 -
 42
42 -
 43
43 -
 44
44 -
 45
45 -
 46
46 -
 47
47 -
 48
48 -
 49
49 -
 50
50 -
 51
51 -
 52
52 -
 53
53 -
 54
54 -
 55
55 -
56
-
57
-
58
-
59
-
60
-
61
-
62
-
63
-
64
-
65
-
66
-
67
-
68
-
69
-
70
-
71
-
72
-
73
-
74
-
75
-
76
-
77
-
78
-
79
-
80
-
81
-
82
-
83
-
84
-
85
-
86
-
87
-
88
-
89
-
90
-
91
-
92
-
93
-
94
-
95
-
96
-
97
-
98
-
99
-
100
-
101
-
102
-
103
-
104
-
105
-
106
-
107
-
108
-
109
-
110
-
111
-
112
-
113
-
114
-
115
-
116
-
117
-
118
-
119
-
120
-
121
-
122
-
123
-
124
 |
 |

Table of Contents
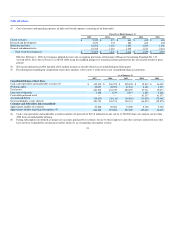
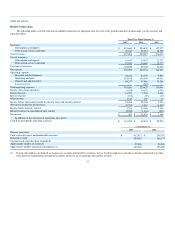
Fiscal Year Ended January 31,
2007 2006 2005
(in thousands)
Revenues by geography:
Americas $ 387,570 $ 247,009 $ 140,871
Europe 75,026 43,577 25,201
Asia Pacific 34,502 19,271 10,303
$ 497,098 $ 309,857 $ 176,375
Cost of revenues and operating expenses include the following amounts related to stock-based awards.
Fiscal Year Ended January 31,
2007 2006 2005
(in thousands)
Stock-based expenses:
Cost of revenues $ 5,522 $ 575 $ 634
Research and development 4,523 332 282
Marketing and sales 18,392 1,325 1,296
General and administrative 10,768 1,216 1,402
$ 39,205 $ 3,448 $ 3,614
Effective February 1, 2006, we adopted the fair value recognition provisions of Statement of Financial Accounting Standards No. 123 (revised 2004),
Share-Based Payment, or SFAS 123R, using the modified prospective transition method and therefore we have not restated results for prior periods.
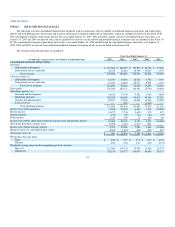
The following tables set forth selected consolidated statements of operations data for each of the periods indicated as a percentage of total revenues.
Fiscal Year Ended January 31,
2007 2006 2005
Revenues:
Subscription and support 91% 91% 90%
Professional services and other 9 9 10
Total revenues 100 100 100
Cost of revenues:
Subscription and support 12 11 7
Professional services and other 12 11 12
Total cost of revenues 24 22 19
Gross profit 76 78 81
Operating expenses:
Research and development 9 8 5
Marketing and sales 51 48 55
General and administrative 17 16 17
Lease recovery — — —
Total operating expenses 77 72 77
Income (loss) from operations (1) 6 4
Interest income 4 3 1
Interest expense — — —
Other income — — —
Income before (provision) benefit for income taxes and minority interest 3 9 5
(Provision) benefit for income taxes (2) 1 (1)
Income before minority interest 1 10 4
Minority interest in consolidated joint venture (1) (1) —
Net income — % 9% 4%
42