Salesforce.com 2006 Annual Report Download - page 61
Download and view the complete annual report
Please find page 61 of the 2006 Salesforce.com annual report below. You can navigate through the pages in the report by either clicking on the pages listed below, or by using the keyword search tool below to find specific information within the annual report.-
 1
1 -
2
-
3
-
4
-
5
-
6
-
7
-
8
-
9
-
10
-
11
-
12
-
13
-
14
-
15
-
16
-
17
-
18
-
19
-
20
-
21
-
22
-
23
-
24
-
25
-
26
-
27
-
28
-
29
-
30
-
31
-
32
-
33
-
34
-
35
-
36
-
37
-
38
-
39
-
40
-
41
-
42
-
43
-
44
-
45
-
46
-
47
-
48
-
49
-
50
-
 51
51 -
 52
52 -
 53
53 -
 54
54 -
 55
55 -
 56
56 -
 57
57 -
 58
58 -
 59
59 -
 60
60 -
 61
61 -
 62
62 -
 63
63 -
 64
64 -
 65
65 -
 66
66 -
 67
67 -
 68
68 -
 69
69 -
 70
70 -
 71
71 -
72
-
73
-
74
-
75
-
76
-
77
-
78
-
79
-
80
-
81
-
82
-
83
-
84
-
85
-
86
-
87
-
88
-
89
-
90
-
91
-
92
-
93
-
94
-
95
-
96
-
97
-
98
-
99
-
100
-
101
-
102
-
103
-
104
-
105
-
106
-
107
-
108
-
109
-
110
-
111
-
112
-
113
-
114
-
115
-
116
-
117
-
118
-
119
-
120
-
121
-
122
-
123
-
124
 |
 |

Table of Contents
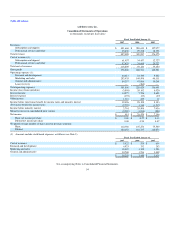
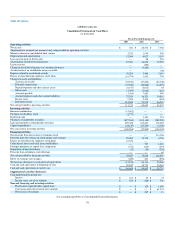
salesforce.com, inc.
Consolidated Statements of Cash Flows
(in thousands)
Fiscal Year Ended January 31,
2007 2006 2005
Operating activities
Net income $ 481 $ 28,474 $ 7,346
Adjustments to reconcile net income to net cash provided by operating activities:
Minority interest in consolidated joint venture 2,220 1,034 590
Depreciation and amortization 12,504 6,027 3,147
Loss on retirement of fixed assets — 48 223
Amortization of deferred commissions 23,381 14,606 15,598
Lease recovery — (285) —
Change in the deferred income tax valuation allowance — (7,225) —
Accrued interest on stockholder notes receivable — — (96)
Expense related to stock-based awards 39,205 3,448 3,614
Excess tax benefits from employee stock plans (16,574) 3,662 798
Changes in assets and liabilities:
Accounts receivable (52,523) (27,254) (22,338)
Deferred commissions (37,856) (22,068) (14,055)
Prepaid expenses and other current assets (8,157) (2,871) 65
Other assets (1,709) (1,620) (216)
Accounts payable (1,764) 7,687 490
Accrued expenses and other current liabilities 27,926 16,521 14,801
Income taxes 9,590 2,434 (318)
Deferred revenue 114,500 73,275 46,223
Net cash provided by operating activities 111,224 95,893 55,872
Investing activities
Business combination (15,502) — —
Purchase of subsidiary stock (2,777) — —
Restricted cash — 3,191 721
Purchases of marketable securities (827,562) (193,165) (282,220)
Sales and maturities of marketable securities 699,368 165,603 136,608
Capital expenditures (22,123) (23,434) (4,308)
Net cash used in investing activities (168,596) (47,805) (149,199)
Financing activities
Net proceeds from the issuance of common stock — — 113,768
Proceeds from the exercise of stock options and warrants 29,082 15,735 4,746
Excess tax benefits from employee stock plans 16,574 — —
Collection of notes receivable from stockholders — 727 1,043
Principal payments on capital lease obligations (617) (614) (493)
Repurchase of unvested shares (12) (28) (254)
Proceeds from subsidiary stock offerings — — 40
Net cash provided by financing activities 45,027 15,820 118,850
Effect of exchange rate changes (889) 203 (255)
Net increase (decrease) in cash and cash equivalents (13,234) 64,111 25,268
Cash and cash equivalents at beginning of year 99,842 35,731 10,463
Cash and cash equivalents at end of year $ 86,608 $ 99,842 $ 35,731
Supplemental cash flow disclosure:
Cash paid during the period for:
Interest $ 193 $ 69 $ 37
Income taxes, net of tax refunds $ 273 $ (169) $ 730
Noncash financing and investing activities
Fixed assets acquired under capital lease $ — $ 129 $ 1,699
Conversion of preferred stock into common $ — $ — $ 61,137
Net exercise of warrants $ — $ 287 $ 15
See accompanying Notes to Consolidated Financial Statements.
58