Salesforce.com 2006 Annual Report Download - page 48
Download and view the complete annual report
Please find page 48 of the 2006 Salesforce.com annual report below. You can navigate through the pages in the report by either clicking on the pages listed below, or by using the keyword search tool below to find specific information within the annual report.-
 1
1 -
2
-
3
-
4
-
5
-
6
-
7
-
8
-
9
-
10
-
11
-
12
-
13
-
14
-
15
-
16
-
17
-
18
-
19
-
20
-
21
-
22
-
23
-
24
-
25
-
26
-
27
-
28
-
29
-
30
-
31
-
32
-
33
-
34
-
35
-
36
-
37
-
 38
38 -
 39
39 -
 40
40 -
 41
41 -
 42
42 -
 43
43 -
 44
44 -
 45
45 -
 46
46 -
 47
47 -
 48
48 -
 49
49 -
 50
50 -
 51
51 -
 52
52 -
 53
53 -
 54
54 -
 55
55 -
 56
56 -
 57
57 -
 58
58 -
59
-
60
-
61
-
62
-
63
-
64
-
65
-
66
-
67
-
68
-
69
-
70
-
71
-
72
-
73
-
74
-
75
-
76
-
77
-
78
-
79
-
80
-
81
-
82
-
83
-
84
-
85
-
86
-
87
-
88
-
89
-
90
-
91
-
92
-
93
-
94
-
95
-
96
-
97
-
98
-
99
-
100
-
101
-
102
-
103
-
104
-
105
-
106
-
107
-
108
-
109
-
110
-
111
-
112
-
113
-
114
-
115
-
116
-
117
-
118
-
119
-
120
-
121
-
122
-
123
-
124
 |
 |

Table of Contents
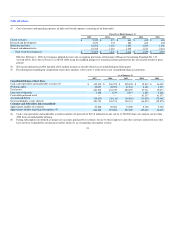
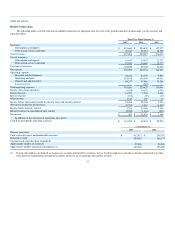
same period a year ago, an increase of $103.3 million. The increase in absolute dollars was primarily due to increases of $71.4 million in employee-related
costs, $17.1 million in stock-based expenses, $2.9 million in marketing, advertising and event costs, $1.5 million in partner referral fees and $9.2 million in
allocated overhead. Our marketing and sales headcount increased by 55 percent since January 31, 2006 as we hired additional sales personnel to focus on
adding new customers and increasing penetration within our existing customer base.
General and Administrative. General and administrative expenses were $84.3 million, or 17 percent of total revenues, during the year ended January 31,
2007, compared to $48.0 million, or 16 percent of total revenues, during the same period a year ago, an increase of $36.3 million. The increase was primarily
due to an increase of $28.8 million in employee-related costs, $9.5 million in stock-based expenses, $6.5 million in infrastructure-related costs and $5.5
million in professional and outside service costs, which were primarily offset by $13.7 million in increased allocated charges to non-general and
administrative departments. Our general and administrative headcount increased by 62 percent since January 31, 2006 as we added personnel to support our
growth.
Operating Income (Loss). Operating loss during the year ended January 31, 2007 was $3.6 million and included $39.2 million of stock-based expenses
related to SFAS 123R. During the same period a year ago, operating income was $20.1 million and included $3.4 million of stock-based expenses. The
increase in our revenues was re-invested in an effort to expand our business.
Interest Income. Interest income consists of investment income on cash and marketable securities balances. Interest income was $15.0 million during
the year ended January 31, 2007 and was $7.7 million during the same period a year ago. The increase was primarily due to increased marketable securities
balances resulting from the cash generated by operating activities and increased market interest rates.
(Provision) Benefit for Income Taxes. We recorded a provision for income taxes of $9.8 million during the year ended January 31, 2007, compared to a
benefit for income taxes of $1.3 million during the same period a year ago. Included in the fiscal 2006 $1.3 million income tax benefit was a $7.2 million
reversal of the valuation allowance related to certain of our deferred tax assets. Prior to the third quarter of last year, we recorded a full valuation allowance to
reserve for the benefit of our deferred tax assets due to the uncertainty surrounding our ability to realize these assets.
The (provision) benefit amounts equated to an effective tax rate of 78 percent for the current period and a negative 5 percent for the same period a year
ago.
The fiscal 2007 provision as a percentage of income before provision for income taxes and minority interest was significantly higher than for the same
period a year ago primarily due to foreign losses for which no tax benefit can be realized, certain nondeductible stock-based expenses resulting from the
adoption of SFAS 123R and the $7.2 million reversal of the valuation allowance a year ago.
Additionally, the impact of adopting SFAS 123R and the business combination accounting adjustments from the acquisition of Sendia Corporation had
a significant impact on the calculation of our effective tax rate because these charges significantly lowered our income before provision for income taxes and
minority interest and we were not able to recognize a full income tax benefit for the stock-based expenses and foreign losses. See Note 6 "Income Taxes" to
the Notes to the Consolidated Financial Statements for our reconciliation of income taxes at the statutory federal rate to the provision for income taxes.
Fiscal Years Ended January 31, 2006 and 2005
Revenues. Total revenues were $309.9 million for the year ended January 31, 2006, compared to $176.4 million during the same period a year ago, an
increase of $133.5 million, or 76 percent. Subscription and support
45