Salesforce.com 2006 Annual Report Download - page 63
Download and view the complete annual report
Please find page 63 of the 2006 Salesforce.com annual report below. You can navigate through the pages in the report by either clicking on the pages listed below, or by using the keyword search tool below to find specific information within the annual report.-
 1
1 -
2
-
3
-
4
-
5
-
6
-
7
-
8
-
9
-
10
-
11
-
12
-
13
-
14
-
15
-
16
-
17
-
18
-
19
-
20
-
21
-
22
-
23
-
24
-
25
-
26
-
27
-
28
-
29
-
30
-
31
-
32
-
33
-
34
-
35
-
36
-
37
-
38
-
39
-
40
-
41
-
42
-
43
-
44
-
45
-
46
-
47
-
48
-
49
-
50
-
51
-
52
-
 53
53 -
 54
54 -
 55
55 -
 56
56 -
 57
57 -
 58
58 -
 59
59 -
 60
60 -
 61
61 -
 62
62 -
 63
63 -
 64
64 -
 65
65 -
 66
66 -
 67
67 -
 68
68 -
 69
69 -
 70
70 -
 71
71 -
 72
72 -
 73
73 -
74
-
75
-
76
-
77
-
78
-
79
-
80
-
81
-
82
-
83
-
84
-
85
-
86
-
87
-
88
-
89
-
90
-
91
-
92
-
93
-
94
-
95
-
96
-
97
-
98
-
99
-
100
-
101
-
102
-
103
-
104
-
105
-
106
-
107
-
108
-
109
-
110
-
111
-
112
-
113
-
114
-
115
-
116
-
117
-
118
-
119
-
120
-
121
-
122
-
123
-
124
 |
 |

Table of Contents
salesforce.com, inc.
Notes to Consolidated Financial Statements—(Continued)
Also, in accordance with SFAS 123R, beginning in fiscal 2007, the Company presented the benefits of tax deductions in excess of recognized
compensation expense ("excess tax benefits from employee stock plans") as a cash flow from financing activity in the accompanying Consolidated Statements
of Cash Flows, rather than as a cash flow from operating activity, as was prescribed under accounting rules applicable through fiscal 2006. These benefits
totaled $16.6 million and $3.7 million during fiscal 2007 and 2006, respectively.
In fiscal 2007, the Company awarded 876,303 restricted stock units to its employees. The restricted stock units, which upon vesting entitles the holder
to one share of common stock for each restricted stock unit, have an exercise price of $0.001 per share, which is equal to the par value of the Company's
common stock, and vest over 4 years. The fair value of the restricted stock units is based on the Company's closing stock price on the date of grant, which
ranged from $29.35 to $39.35 per share during fiscal 2007, and compensation expense, net of estimated forfeitures, is recognized on a straight-line basis over
the vesting period.
As of January 31, 2007, the aggregate stock compensation remaining to be amortized to costs and expenses was $152.4 million. The Company expects
this stock compensation balance to be amortized as follows: $53.5 million during fiscal 2008; $47.3 million during fiscal 2009; $36.5 million during fiscal
2010; and $15.1 million during fiscal 2011. The expected amortization reflects only outstanding stock awards as of January 31, 2007 and assumes there will
be no forfeiture activity.
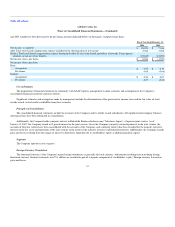
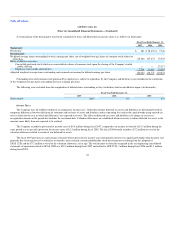
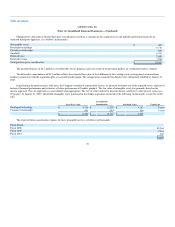
The fair value of each option grant was estimated on the date of grant using the Black-Scholes option pricing model with the following assumptions and
fair value per share:
Fiscal Year Ended January 31,
2007 2006 2005
Volatility 46 - 50% 50 - 75% 75 - 100%
Weighted-average estimated life 4 years 4 years 4 years
Weighted-average risk-free interest rate 4.42 - 5.03% 3.79 - 4.52% 2.86 - 3.70%
Dividend yield — — —
Weighted-average fair value per share of grants $14.92 $11.11 $7.42
The expected life of options granted is based on the simplified calculation of expected life, described in the U.S. Securities and Exchange Commission's
Staff Accounting Bulletin 107. Accordingly, the weighted-average estimated life assumption of 4 years is based on the average of the vesting term and the 5
year contractual lives of all options awarded after February 1, 2006. The weighted-average risk free interest rate is based on the rate for a 4 year U.S.
government security at the time of the option grant.
During the three months ended July 31, 2005, the Company reevaluated the assumptions used to estimate the future volatility of its stock price. The
Company estimated its future stock price volatility considering both observed option-implied volatilities and historical volatility calculations for both the
Company and a group of peer comparable companies. Management believes this is the best estimate of the expected volatility over the 4 year weighted-
average expected life of its option grants. As a result of its reevaluation and the general market decline in share price volatilities, the Company reduced its
volatility assumption from 75 percent to 50 percent. As of January 31, 2007, the Company's estimate of its future stock price volatility is 46 percent.
Had compensation cost for the Company's stock-based compensation plans been determined using the fair-value method at the grant date for awards
under those plans calculated using the Black-Scholes pricing model and recognized on a straight-line basis over the option vesting periods, the Company's net
income for fiscal 2006
60