Salesforce.com 2006 Annual Report Download - page 50
Download and view the complete annual report
Please find page 50 of the 2006 Salesforce.com annual report below. You can navigate through the pages in the report by either clicking on the pages listed below, or by using the keyword search tool below to find specific information within the annual report.-
 1
1 -
2
-
3
-
4
-
5
-
6
-
7
-
8
-
9
-
10
-
11
-
12
-
13
-
14
-
15
-
16
-
17
-
18
-
19
-
20
-
21
-
22
-
23
-
24
-
25
-
26
-
27
-
28
-
29
-
30
-
31
-
32
-
33
-
34
-
35
-
36
-
37
-
38
-
39
-
 40
40 -
 41
41 -
 42
42 -
 43
43 -
 44
44 -
 45
45 -
 46
46 -
 47
47 -
 48
48 -
 49
49 -
 50
50 -
 51
51 -
 52
52 -
 53
53 -
 54
54 -
 55
55 -
 56
56 -
 57
57 -
 58
58 -
 59
59 -
 60
60 -
61
-
62
-
63
-
64
-
65
-
66
-
67
-
68
-
69
-
70
-
71
-
72
-
73
-
74
-
75
-
76
-
77
-
78
-
79
-
80
-
81
-
82
-
83
-
84
-
85
-
86
-
87
-
88
-
89
-
90
-
91
-
92
-
93
-
94
-
95
-
96
-
97
-
98
-
99
-
100
-
101
-
102
-
103
-
104
-
105
-
106
-
107
-
108
-
109
-
110
-
111
-
112
-
113
-
114
-
115
-
116
-
117
-
118
-
119
-
120
-
121
-
122
-
123
-
124
 |
 |

Table of Contents
Lease Recovery. The lease recovery of $285,000, which occurred during the first quarter of fiscal 2006, was due to the reduction in accruals associated
with the San Francisco, California office space that we abandoned in December 2001. In March 2005, we entered into an agreement with our primary landlord
that released us from a portion of the future obligations associated with the remaining space abandoned in exchange for an agreement to lease additional space
elsewhere in the building at fair value. Accordingly, we recorded a $285,000 credit to reflect the reversal of a portion of the accrual that was directly related to
this space.
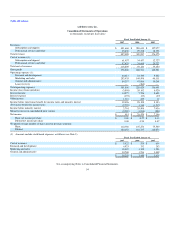
Operating Income. Operating income during the year ended January 31, 2006 was $20.1 million. During the same period a year ago, it was $6.5
million. The increase was primarily due to the increase in revenues, most of which was re-invested in an effort to expand our business.
Interest Income. Interest income consists of investment income on cash and marketable securities balances. During the year ended January 31, 2005,
interest income also included the interest income on outstanding loans made to individuals who early exercised their stock options. None of these individuals
was an executive officer or director of the Company and all of them repaid their loan balances by February 28, 2005. Interest income was $7.7 million during
the year ended January 31, 2006 and was $2.7 million during the same period a year ago. The increase was primarily due to increased marketable securities
balances resulting from the $113.8 million of net proceeds from the sale of our common stock in our initial public offering in June 2004 and the cash
generated by operating activities since January 31, 2005.
Benefit (Provision) for Income Taxes. We recorded a benefit for income taxes of $1.3 million during the year ended January 31, 2006, compared to a
provision for income taxes of $1.2 million during the same period a year ago. Included in the $1.3 million benefit for income taxes was a partial reversal of
the valuation allowance related to certain of our deferred tax assets totaling $7.2 million. Prior to fiscal 2006, we recorded a full valuation allowance to
reserve for the benefit of our deferred tax assets due to the uncertainty surrounding our ability to realize these assets. As of January 31, 2006, we had $7.2
million of deferred tax assets, net of deferred tax liabilities, on our consolidated balance sheet.
As of January 31, 2006, we maintained a $41.8 million valuation allowance against the deferred tax assets attributable to employee stock option
exercises and operating losses from certain foreign subsidiaries.
This effective tax rate differs from the statutory rate primarily due to the utilization of previously unrecognized domestic loss carryovers offset by
losses in certain foreign jurisdictions for which no benefit was recognized. See Note 6 "Income Taxes" to the Notes to the Consolidated Financial Statements
for our reconciliation of income taxes at the statutory federal rate to the provision for income taxes.
Liquidity and Capital Resources
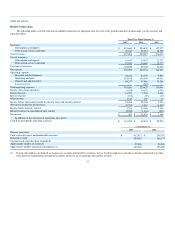
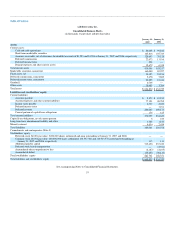
At January 31, 2007, our principal sources of liquidity were cash, cash equivalents and marketable securities totaling $412.5 million and accounts
receivable of $128.7 million.
Net cash provided by operating activities was $111.2 million during the year ended January 31, 2007 and $95.9 million during the same period a year
ago. The improvement in cash flow was due primarily to the increased number of paying subscribers to our service. Cash provided by operating activities has
historically been affected by sales of subscriptions and support and professional services, changes in working capital accounts, particularly increases in
accounts receivable and deferred revenue and the timing of commission and bonus payments, and add-backs of non-cash expense items such as depreciation
and amortization and the expense associated with stock-based awards.
Net cash used in investing activities was $168.6 million during the year ended January 31, 2007 and $47.8 million during the same period a year ago.
The net cash used in investing activities during the year ended January 31, 2007 primarily related to the investment of operating cash balances and capital
expenditures
47