Saks Fifth Avenue 2008 Annual Report Download - page 99
Download and view the complete annual report
Please find page 99 of the 2008 Saks Fifth Avenue annual report below. You can navigate through the pages in the report by either clicking on the pages listed below, or by using the keyword search tool below to find specific information within the annual report.-
 1
1 -
2
-
3
-
4
-
5
-
6
-
7
-
8
-
9
-
10
-
11
-
12
-
13
-
14
-
15
-
16
-
17
-
18
-
19
-
20
-
21
-
22
-
23
-
24
-
25
-
26
-
27
-
28
-
29
-
30
-
31
-
32
-
33
-
34
-
35
-
36
-
37
-
38
-
39
-
40
-
41
-
42
-
43
-
44
-
45
-
46
-
47
-
48
-
49
-
50
-
51
-
52
-
53
-
54
-
55
-
56
-
57
-
58
-
59
-
60
-
61
-
62
-
63
-
64
-
65
-
66
-
67
-
68
-
69
-
70
-
71
-
72
-
73
-
74
-
75
-
76
-
77
-
78
-
79
-
80
-
81
-
82
-
83
-
84
-
85
-
86
-
87
-
88
-
 89
89 -
 90
90 -
 91
91 -
 92
92 -
 93
93 -
 94
94 -
 95
95 -
 96
96 -
 97
97 -
 98
98 -
 99
99 -
 100
100 -
 101
101 -
 102
102 -
 103
103 -
 104
104 -
 105
105 -
 106
106 -
 107
107 -
 108
108 -
 109
109 -
110
-
111
-
112
-
113
-
114
-
115
-
116
-
117
-
118
-
119
-
120
-
121
-
122
-
123
-
124
-
125
-
126
-
127
-
128
-
129
-
130
-
131
-
132
-
133
-
134
-
135
-
136
-
137
-
138
-
139
-
140
-
141
-
142
-
143
-
144
-
145
-
146
-
147
-
148
-
149
-
150
-
151
-
152
-
153
-
154
-
155
-
156
-
157
-
158
-
159
-
160
-
161
-
162
-
163
-
164
-
165
-
166
-
167
-
168
-
169
-
170
-
171
-
172
-
173
-
174
-
175
-
176
-
177
-
178
-
179
-
180
-
181
-
182
-
183
-
184
-
185
-
186
-
187
-
188
-
189
-
190
-
191
-
192
-
193
-
194
-
195
-
196
-
197
-
198
-
199
-
200
-
201
-
202
-
203
-
204
-
205
-
206
-
207
-
208
-
209
-
210
-
211
-
212
-
213
-
214
-
215
-
216
-
217
-
218
-
219
-
220
-
221
-
222
-
223
-
224
-
225
-
226
-
227
-
228
-
229
-
230
-
231
-
232
-
233
-
234
-
235
-
236
-
237
-
238
-
239
-
240
-
241
-
242
-
243
-
244
-
245
-
246
-
247
-
248
-
249
-
250
-
251
-
252
-
253
-
254
-
255
-
256
-
257
-
258
-
259
-
260
-
261
-
262
-
263
-
264
-
265
-
266
-
267
-
268
-
269
-
270
-
271
-
272
-
273
-
274
-
275
-
276
-
277
-
278
-
279
-
280
-
281
-
282
-
283
-
284
-
285
-
286
-
287
-
288
-
289
-
290
-
291
-
292
 |
 |

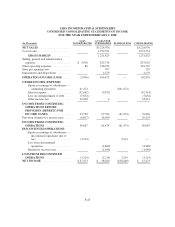
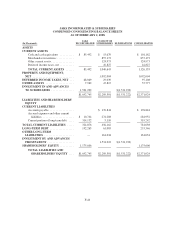
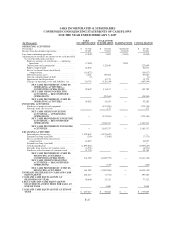
SAKS INCORPORATED & SUBSIDIARIES
CONDENSED CONSOLIDATING STATEMENTS OF CASH FLOWS
FOR THE YEAR ENDED FEBRUARY 2, 2008
(In Thousands)
SAKS
INCORPORATED
GUARANTOR
SUBSIDIARIES ELIMINATIONS CONSOLIDATED
OPERATING ACTIVITIES
Net income ................................. $ 47,473 $ 58,260 $(58,260) $ 47,473
Loss from discontinued operations ............... (3,214) (3,214) 3,214 (3,214)
Income from continuing operations .............. 50,687 61,474 (61,474) 50,687
Adjustments to reconcile net income to net cash
(used in) provided by operating activities:
Equity in earnings of subsidiaries ............ (61,474) — 61,474 —
Depreciation and amortization .............. 131,737 131,737
Equity Compensation ..................... 7,724 7,724
Gain on lease termination .................. (1,669) (1,669)
Gain on sale of building ................... (1,069) (1,069)
Deferred income taxes .................... 3,966 22,220 26,186
Loss on extinguishment of debt ............. 5,634 5,634
Impairments and dispositions ............... 4,279 4,279
liabilities, net ............................ 50,616 (206,726) (156,110)
NET CASH PROVIDED BY
OPERATING ACTIVITIES —
CONTINUING OPERATIONS ..... 57,153 10,246 — 67,399
NET CASH PROVIDED BY
OPERATING ACTIVITIES —
DISCONTINUED OPERATIONS . . . 4,080 4,080
NET CASH PROVIDED BY
OPERATING ACTIVITIES ........ 57,153 14,326 — 71,479
INVESTING ACTIVITIES
Purchases of property and equipment ......... (136,726) (136,726)
Proceeds from sale of assets ................ 12,352 12,352
NET CASH USED IN INVESTING
ACTIVITIES — CONTINUING
OPERATIONS ................... — (124,374) — (124,374)
NET CASH USED IN INVESTING
ACTIVITIES — DISCONTINUED
OPERATIONS ................... (4,259) (4,259)
NET CASH USED IN INVESTING
ACTIVITIES ..................... — (128,633) — (128,633)
FINANCING ACTIVITIES
Intercompany borrowings .................. (236,319) 236,319
Payments on long-term debt and capital lease
obligations ............................ (263) (118,717) (118,980)
Payment of dividend ...................... (7,430) (7,430)
Purchase of common stock ................. (27,464) (27,464)
Proceeds from issuance of stock ............. 34,307 34,307
Purchases and retirements of common stock . . . — —
NET CASH PROVIDED BY (USED IN)
FINANCING ACTIVITIES —
CONTINUING OPERATIONS ..... (237,169) 117,602 — (119,567)
NET CASH USED IN FINANCING
ACTIVITIES — DISCONTINUED
OPERATIONS ................... — —
NET CASH PROVIDED BY (USED IN)
FINANCING ACTIVITIES ......... (237,169) 117,602 — (119,567)
INCREASE (DECREASE) IN CASH AND CASH
EQUIVALENTS .......................... (180,016) 3,295 — (176,721)
CASH AND CASH EQUIVALENTS AT
BEGINNING OF YEAR ................... 265,508 12,375 277,883
CASH AND CASH EQUIVALENTS AT END OF
YEAR ................................... $ 85,492 $ 15,670 $ — $ 101,162
F-45