Saks Fifth Avenue 2008 Annual Report Download - page 60
Download and view the complete annual report
Please find page 60 of the 2008 Saks Fifth Avenue annual report below. You can navigate through the pages in the report by either clicking on the pages listed below, or by using the keyword search tool below to find specific information within the annual report.-
 1
1 -
2
-
3
-
4
-
5
-
6
-
7
-
8
-
9
-
10
-
11
-
12
-
13
-
14
-
15
-
16
-
17
-
18
-
19
-
20
-
21
-
22
-
23
-
24
-
25
-
26
-
27
-
28
-
29
-
30
-
31
-
32
-
33
-
34
-
35
-
36
-
37
-
38
-
39
-
40
-
41
-
42
-
43
-
44
-
45
-
46
-
47
-
48
-
49
-
 50
50 -
 51
51 -
 52
52 -
 53
53 -
 54
54 -
 55
55 -
 56
56 -
 57
57 -
 58
58 -
 59
59 -
 60
60 -
 61
61 -
 62
62 -
 63
63 -
 64
64 -
 65
65 -
 66
66 -
 67
67 -
 68
68 -
 69
69 -
 70
70 -
71
-
72
-
73
-
74
-
75
-
76
-
77
-
78
-
79
-
80
-
81
-
82
-
83
-
84
-
85
-
86
-
87
-
88
-
89
-
90
-
91
-
92
-
93
-
94
-
95
-
96
-
97
-
98
-
99
-
100
-
101
-
102
-
103
-
104
-
105
-
106
-
107
-
108
-
109
-
110
-
111
-
112
-
113
-
114
-
115
-
116
-
117
-
118
-
119
-
120
-
121
-
122
-
123
-
124
-
125
-
126
-
127
-
128
-
129
-
130
-
131
-
132
-
133
-
134
-
135
-
136
-
137
-
138
-
139
-
140
-
141
-
142
-
143
-
144
-
145
-
146
-
147
-
148
-
149
-
150
-
151
-
152
-
153
-
154
-
155
-
156
-
157
-
158
-
159
-
160
-
161
-
162
-
163
-
164
-
165
-
166
-
167
-
168
-
169
-
170
-
171
-
172
-
173
-
174
-
175
-
176
-
177
-
178
-
179
-
180
-
181
-
182
-
183
-
184
-
185
-
186
-
187
-
188
-
189
-
190
-
191
-
192
-
193
-
194
-
195
-
196
-
197
-
198
-
199
-
200
-
201
-
202
-
203
-
204
-
205
-
206
-
207
-
208
-
209
-
210
-
211
-
212
-
213
-
214
-
215
-
216
-
217
-
218
-
219
-
220
-
221
-
222
-
223
-
224
-
225
-
226
-
227
-
228
-
229
-
230
-
231
-
232
-
233
-
234
-
235
-
236
-
237
-
238
-
239
-
240
-
241
-
242
-
243
-
244
-
245
-
246
-
247
-
248
-
249
-
250
-
251
-
252
-
253
-
254
-
255
-
256
-
257
-
258
-
259
-
260
-
261
-
262
-
263
-
264
-
265
-
266
-
267
-
268
-
269
-
270
-
271
-
272
-
273
-
274
-
275
-
276
-
277
-
278
-
279
-
280
-
281
-
282
-
283
-
284
-
285
-
286
-
287
-
288
-
289
-
290
-
291
-
292
 |
 |

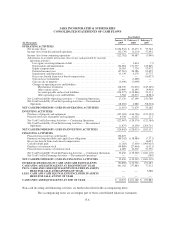
SAKS INCORPORATED & SUBSIDIARIES
CONSOLIDATED STATEMENTS OF CASH FLOWS
(In Thousands)
Year Ended
January 31,
2009
February 2,
2008
February 3,
2007
OPERATING ACTIVITIES
Net income (loss) .................................................... $(154,941) $ 47,473 $ 53,742
Income (loss) from discontinued operations ................................ (32,179) (3,214) 57,691
Income (loss) from continuing operations ................................. (122,762) 50,687 (3,949)
Adjustments to reconcile net income (loss) to net cash provided by (used in)
operating activities:
Loss (gain) on extinguishment of debt ................................ — 5,634 (7)
Depreciation and amortization ...................................... 134,694 131,737 125,849
Equity compensation .............................................. 16,395 7,724 52,072
Deferred income taxes ............................................ (47,210) 26,186 93,625
Impairments and dispositions ....................................... 11,139 4,279 11,775
Excess tax benefit from stock-based compensation ...................... — — (16,027)
Gain on lease termination .......................................... — (1,669) —
Gain on sale of property ........................................... (3,400) (1,069) —
Changes in operating assets and liabilities:
Merchandise inventories ....................................... 118,539 (71,032) (143,349)
Other current assets ........................................... 20,990 12,495 (9,930)
Accounts payable and accrued liabilities .......................... (114,577) (119,846) 52,111
Other operating assets and liabilities ............................. 3,362 22,273 (8,381)
Net Cash Provided By Operating Activities — Continuing Operations ........... 17,170 67,399 153,789
Net Cash Provided By (Used In) Operating Activities — Discontinued
Operations ........................................................ (18,667) 4,080 (98,504)
NET CASH PROVIDED BY (USED IN) OPERATING ACTIVITIES ........... (1,497) 71,479 55,285
INVESTING ACTIVITIES
Purchases of property and equipment ..................................... (127,305) (136,726) (121,355)
Proceeds from sale of property and equipment .............................. 4,338 12,352 171
Net Cash Used In Investing Activities — Continuing Operations ............... (122,967) (124,374) (121,184)
Net Cash Provided By (Used In) Investing Activities — Discontinued
Operations ........................................................ (1,875) (4,259) 1,304,701
NET CASH PROVIDED BY (USED IN) INVESTING ACTIVITIES ............ (124,842) (128,633) 1,183,517
FINANCING ACTIVITIES
Proceeds from revolving credit facility .................................... 156,675 — —
Payments on long-term debt and capital lease obligations ..................... (89,242) (118,980) (7,371)
Excess tax benefit from stock-based compensation .......................... — — 16,027
Cash dividends paid .................................................. (1,183) (7,430) (1,095,025)
Purchases of common stock ............................................ (34,889) (27,464) (6,531)
Proceeds from issuance of common stock ................................. 4,089 34,307 51,730
Net Cash Provided By (Used In) Financing Activities — Continuing Operations . . 35,450 (119,567) (1,041,170)
Net Cash Used In Financing Activities — Discontinued Operations ............. — — (149)
NET CASH PROVIDED BY (USED IN) FINANCING ACTIVITIES ............ 35,450 (119,567) (1,041,319)
INCREASE (DECREASE) IN CASH AND CASH EQUIVALENTS ............. (90,889) (176,721) 197,483
CASH AND CASH EQUIVALENTS AT BEGINNING OF YEAR .............. 101,162 277,883 77,312
PLUS: CASH AND CASH EQUIVALENTS INCLUDED IN ASSETS
HELD FOR SALE AT BEGINNING OF YEAR ........................ — — 3,088
LESS: CASH AND CASH EQUIVALENTS INCLUDED IN ASSETS
HELD FOR SALE AT END OF YEAR ............................... — — —
CASH AND CASH EQUIVALENTS AT END OF YEAR ...................... $ 10,273 $ 101,162 $ 277,883
Non-cash investing and financing activities are further described in the accompanying notes.
The accompanying notes are an integral part of these consolidated financial statements.
F-6