Saks Fifth Avenue 2008 Annual Report Download - page 19
Download and view the complete annual report
Please find page 19 of the 2008 Saks Fifth Avenue annual report below. You can navigate through the pages in the report by either clicking on the pages listed below, or by using the keyword search tool below to find specific information within the annual report.-
 1
1 -
2
-
3
-
4
-
5
-
6
-
7
-
8
-
 9
9 -
 10
10 -
 11
11 -
 12
12 -
 13
13 -
 14
14 -
 15
15 -
 16
16 -
 17
17 -
 18
18 -
 19
19 -
 20
20 -
 21
21 -
 22
22 -
 23
23 -
 24
24 -
 25
25 -
 26
26 -
 27
27 -
 28
28 -
 29
29 -
30
-
31
-
32
-
33
-
34
-
35
-
36
-
37
-
38
-
39
-
40
-
41
-
42
-
43
-
44
-
45
-
46
-
47
-
48
-
49
-
50
-
51
-
52
-
53
-
54
-
55
-
56
-
57
-
58
-
59
-
60
-
61
-
62
-
63
-
64
-
65
-
66
-
67
-
68
-
69
-
70
-
71
-
72
-
73
-
74
-
75
-
76
-
77
-
78
-
79
-
80
-
81
-
82
-
83
-
84
-
85
-
86
-
87
-
88
-
89
-
90
-
91
-
92
-
93
-
94
-
95
-
96
-
97
-
98
-
99
-
100
-
101
-
102
-
103
-
104
-
105
-
106
-
107
-
108
-
109
-
110
-
111
-
112
-
113
-
114
-
115
-
116
-
117
-
118
-
119
-
120
-
121
-
122
-
123
-
124
-
125
-
126
-
127
-
128
-
129
-
130
-
131
-
132
-
133
-
134
-
135
-
136
-
137
-
138
-
139
-
140
-
141
-
142
-
143
-
144
-
145
-
146
-
147
-
148
-
149
-
150
-
151
-
152
-
153
-
154
-
155
-
156
-
157
-
158
-
159
-
160
-
161
-
162
-
163
-
164
-
165
-
166
-
167
-
168
-
169
-
170
-
171
-
172
-
173
-
174
-
175
-
176
-
177
-
178
-
179
-
180
-
181
-
182
-
183
-
184
-
185
-
186
-
187
-
188
-
189
-
190
-
191
-
192
-
193
-
194
-
195
-
196
-
197
-
198
-
199
-
200
-
201
-
202
-
203
-
204
-
205
-
206
-
207
-
208
-
209
-
210
-
211
-
212
-
213
-
214
-
215
-
216
-
217
-
218
-
219
-
220
-
221
-
222
-
223
-
224
-
225
-
226
-
227
-
228
-
229
-
230
-
231
-
232
-
233
-
234
-
235
-
236
-
237
-
238
-
239
-
240
-
241
-
242
-
243
-
244
-
245
-
246
-
247
-
248
-
249
-
250
-
251
-
252
-
253
-
254
-
255
-
256
-
257
-
258
-
259
-
260
-
261
-
262
-
263
-
264
-
265
-
266
-
267
-
268
-
269
-
270
-
271
-
272
-
273
-
274
-
275
-
276
-
277
-
278
-
279
-
280
-
281
-
282
-
283
-
284
-
285
-
286
-
287
-
288
-
289
-
290
-
291
-
292
 |
 |

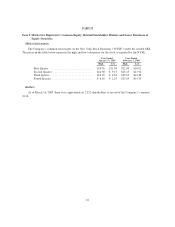
Purchases of Equity Securities by the Issuer and Affiliated Purchasers
The Company has a share repurchase program that authorizes it to purchase shares of the Company’s
common stock. The Company repurchased approximately 2.9 million shares of its common stock during the year
ended January 31, 2009 at an average price of $11.83 per share and a total cost of approximately $34.9 million.
The Company has remaining availability of approximately 32.7 million shares under its 70 million authorized
share repurchase program. The Company did not repurchase any shares of common stock during the fourth
quarter of fiscal 2008.
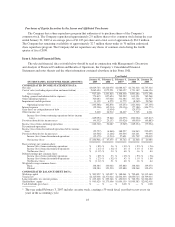
Item 6. Selected Financial Data.
The selected financial data set forth below should be read in conjunction with Management’s Discussion
and Analysis of Financial Condition and Results of Operations, the Company’s Consolidated Financial
Statements and notes thereto and the other information contained elsewhere in this Form 10-K.
Year Ended
(IN THOUSANDS, EXCEPT PER SHARE AMOUNTS)
January 31,
2009
February 2,
2008
February 3,
2007*
January 28,
2006
January 29,
2005
CONSOLIDATED INCOME STATEMENT DATA:
Net sales .............................................. $3,029,743 $3,224,076 $2,888,427 $2,732,428 $2,737,324
Cost of sales (excluding depreciation and amortization) ......... 2,062,494 1,972,251 1,780,127 1,731,142 1,666,126
Gross margin ...................................... 967,249 1,251,825 1,108,300 1,001,286 1,071,198
Selling, general and administrative expenses .................. 770,815 827,624 799,292 813,321 785,568
Other operating expenses ................................. 320,683 317,046 312,486 317,760 311,967
Impairments and dispositions .............................. 11,139 4,279 11,775 (8,349) 20,768
Operating income (loss) .............................. (135,388) 102,876 (15,253) (121,446) (47,105)
Interest expense ........................................ (39,306) (42,314) (50,136) (77,188) (104,773)
Gain (loss) on extinguishment of debt ....................... — (5,634) 7 (29,375) —
Other income, net ....................................... 5,600 24,912 28,407 7,705 4,061
Income (loss) from continuing operations before income
taxes ........................................... (169,094) 79,840 (36,975) (220,304) (147,817)
Provision (benefit) for income taxes ........................ (46,332) 29,153 (33,026) (90,950) (69,883)
Income (loss) from continuing operations .................... (122,762) 50,687 (3,949) (129,354) (77,934)
Discontinued operations:
Income (loss) from discontinued operations before income
taxes ............................................... (52,727) (4,860) 188,227 314,943 232,055
Provision (benefit) for income taxes ........................ (20,548) (1,646) 130,536 163,241 93,036
Income (loss) from discontinued operations .............. (32,179) (3,214) 57,691 151,702 139,019
Net income (loss) ................................... $ (154,941) $ 47,473 $ 53,742 $ 22,348 $ 61,085
Basic earnings per common share:
Income (loss) from continuing operations ................ $ (.89) $ .36 $ (.03) $ (.93) $ (.56)
Income (loss) from discontinued operations .............. $ (.23) $ (.02) $ .43 $ 1.10 $ 1.00
Net Income (loss) ................................... $ (1.12) $ .34 $ .40 $ .16 $ .44
Diluted earnings per common share:
Income (loss) from continuing operations ................ $ (.89) $ .33 $ (.03) $ (.93) $ (.56)
Income (loss) from discontinued operations .............. $ (.23) $ (.02) $ .43 $ 1.10 $ 1.00
Net Income (loss) ................................... $ (1.12) $ .31 $ .40 $ .16 $ .44
Weighted average common shares:
Basic ............................................. 138,384 140,402 135,880 138,348 139,470
Diluted ........................................... 138,384 153,530 135,880 138,348 139,470
CONSOLIDATED BALANCE SHEET DATA:
Working capital ........................................ $ 503,952 $ 345,097 $ 388,061 $ 799,601 $1,115,460
Total assets ............................................ $2,165,008 $2,371,024 $2,544,303 $3,850,725 $4,709,014
Long-term debt, less current portion ........................ $ 635,400 $ 253,346 $ 450,010 $ 722,736 $1,346,222
Shareholders’ equity ..................................... $ 965,620 $1,175,606 $1,096,139 $1,999,383 $2,062,418
Cash dividends (per share) ................................ $ — $ — $ 8.00 $ — $ 2.00
* The year ended February 3, 2007 includes an extra week, creating a 53-week fiscal year that occurs every six
years in the accounting cycle.
18