Saks Fifth Avenue 2008 Annual Report Download - page 25
Download and view the complete annual report
Please find page 25 of the 2008 Saks Fifth Avenue annual report below. You can navigate through the pages in the report by either clicking on the pages listed below, or by using the keyword search tool below to find specific information within the annual report.-
 1
1 -
2
-
3
-
4
-
5
-
6
-
7
-
8
-
9
-
10
-
11
-
12
-
13
-
14
-
 15
15 -
 16
16 -
 17
17 -
 18
18 -
 19
19 -
 20
20 -
 21
21 -
 22
22 -
 23
23 -
 24
24 -
 25
25 -
 26
26 -
 27
27 -
 28
28 -
 29
29 -
 30
30 -
 31
31 -
 32
32 -
 33
33 -
 34
34 -
 35
35 -
36
-
37
-
38
-
39
-
40
-
41
-
42
-
43
-
44
-
45
-
46
-
47
-
48
-
49
-
50
-
51
-
52
-
53
-
54
-
55
-
56
-
57
-
58
-
59
-
60
-
61
-
62
-
63
-
64
-
65
-
66
-
67
-
68
-
69
-
70
-
71
-
72
-
73
-
74
-
75
-
76
-
77
-
78
-
79
-
80
-
81
-
82
-
83
-
84
-
85
-
86
-
87
-
88
-
89
-
90
-
91
-
92
-
93
-
94
-
95
-
96
-
97
-
98
-
99
-
100
-
101
-
102
-
103
-
104
-
105
-
106
-
107
-
108
-
109
-
110
-
111
-
112
-
113
-
114
-
115
-
116
-
117
-
118
-
119
-
120
-
121
-
122
-
123
-
124
-
125
-
126
-
127
-
128
-
129
-
130
-
131
-
132
-
133
-
134
-
135
-
136
-
137
-
138
-
139
-
140
-
141
-
142
-
143
-
144
-
145
-
146
-
147
-
148
-
149
-
150
-
151
-
152
-
153
-
154
-
155
-
156
-
157
-
158
-
159
-
160
-
161
-
162
-
163
-
164
-
165
-
166
-
167
-
168
-
169
-
170
-
171
-
172
-
173
-
174
-
175
-
176
-
177
-
178
-
179
-
180
-
181
-
182
-
183
-
184
-
185
-
186
-
187
-
188
-
189
-
190
-
191
-
192
-
193
-
194
-
195
-
196
-
197
-
198
-
199
-
200
-
201
-
202
-
203
-
204
-
205
-
206
-
207
-
208
-
209
-
210
-
211
-
212
-
213
-
214
-
215
-
216
-
217
-
218
-
219
-
220
-
221
-
222
-
223
-
224
-
225
-
226
-
227
-
228
-
229
-
230
-
231
-
232
-
233
-
234
-
235
-
236
-
237
-
238
-
239
-
240
-
241
-
242
-
243
-
244
-
245
-
246
-
247
-
248
-
249
-
250
-
251
-
252
-
253
-
254
-
255
-
256
-
257
-
258
-
259
-
260
-
261
-
262
-
263
-
264
-
265
-
266
-
267
-
268
-
269
-
270
-
271
-
272
-
273
-
274
-
275
-
276
-
277
-
278
-
279
-
280
-
281
-
282
-
283
-
284
-
285
-
286
-
287
-
288
-
289
-
290
-
291
-
292
 |
 |
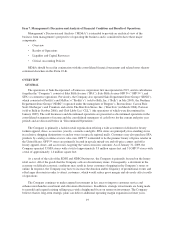
January 31, 2009. The decline in gross margin dollars and the gross margin rate was principally due to aggressive
markdowns taken in the fourth quarter of 2008 as the Company initiated promotional activities in an effort to
stimulate consumer demand and reduce inventory levels.
NET SALES
For the year ended January 31, 2009, total sales decreased 6.0% to $3,029.7 million from $3,224.1 million
for the year ended February 2, 2008. Consolidated comparable store sales decreased $197.3 million, or 6.1%
from $3,211.7 million for the year ended February 2, 2008 to $3,014.4 million for the year ended January 31,
2009.
Comparable store sales are calculated on a rolling 13-month basis. Thus, to be included in the comparison, a
store must be open for 13 months. The additional month is used to transition the first month impact of a new
store opening. Correspondingly, closed stores are removed from the comparable store sales comparison when
they begin liquidating merchandise. Expanded, remodeled, converted and re-branded stores are included in the
comparable store sales comparison, except for the periods in which they are closed for remodeling and
renovation.
GROSS MARGIN
For the year ended January 31, 2009, gross margin was $967.2 million, or 31.9% of net sales, compared to
$1,251.8 million, or 38.8% of net sales, for the year ended February 2, 2008. The decline in gross margin dollars
and gross margin rate was primarily driven by incremental markdowns as the Company reacted to the rapidly
deteriorating economic conditions and aggressively worked to clear excess inventory.
SELLING, GENERAL AND ADMINISTRATIVE EXPENSES
For the year ended January 31, 2009, SG&A was $770.8 million, or 25.4% of net sales, compared to $827.6
million, or 25.7% of net sales, for the year ended February 2, 2008. The decrease of $56.8 million in expenses
was primarily driven by lower variable expenses associated with the year over year sales decrease of $194.4
million, general expense reduction and a decrease in severance, retention and transition costs of $19.6 million
from the prior year. As a percentage of sales, SG&A decreased by 20 basis points over the prior year.
Amounts received from vendors in conjunction with compensation programs and cooperative advertising
were consistent with the related gross compensation and cooperative advertising expenditures and therefore had
no significant impact on SG&A expense, in dollars or as a percentage of net sales.
OTHER OPERATING EXPENSES
For the year ended January 31, 2009, other operating expenses were $320.7 million, or 10.6% of net sales,
compared to $317.0 million, or 9.8% of net sales, for the year ended February 2, 2008. The increase of $3.7
million was principally driven by higher depreciation and amortization expense and property and equipment
rentals of $3.0 million and $1.0 million, respectively and an increase in store pre-opening costs of $1.6 million.
These increases were partially offset by a decrease in taxes other than income taxes of $1.9 million.
IMPAIRMENTS AND DISPOSITIONS
For the year ended January 31, 2009, the Company recognized net charges from impairments and
dispositions of $11.1 million compared to net charges of $4.3 million for the year ended February 2, 2008. The
current and prior year net charges were primarily due to asset impairments in the normal course of business.
24