Saks Fifth Avenue 2008 Annual Report Download - page 84
Download and view the complete annual report
Please find page 84 of the 2008 Saks Fifth Avenue annual report below. You can navigate through the pages in the report by either clicking on the pages listed below, or by using the keyword search tool below to find specific information within the annual report.-
 1
1 -
2
-
3
-
4
-
5
-
6
-
7
-
8
-
9
-
10
-
11
-
12
-
13
-
14
-
15
-
16
-
17
-
18
-
19
-
20
-
21
-
22
-
23
-
24
-
25
-
26
-
27
-
28
-
29
-
30
-
31
-
32
-
33
-
34
-
35
-
36
-
37
-
38
-
39
-
40
-
41
-
42
-
43
-
44
-
45
-
46
-
47
-
48
-
49
-
50
-
51
-
52
-
53
-
54
-
55
-
56
-
57
-
58
-
59
-
60
-
61
-
62
-
63
-
64
-
65
-
66
-
67
-
68
-
69
-
70
-
71
-
72
-
73
-
 74
74 -
 75
75 -
 76
76 -
 77
77 -
 78
78 -
 79
79 -
 80
80 -
 81
81 -
 82
82 -
 83
83 -
 84
84 -
 85
85 -
 86
86 -
 87
87 -
 88
88 -
 89
89 -
 90
90 -
 91
91 -
 92
92 -
 93
93 -
 94
94 -
95
-
96
-
97
-
98
-
99
-
100
-
101
-
102
-
103
-
104
-
105
-
106
-
107
-
108
-
109
-
110
-
111
-
112
-
113
-
114
-
115
-
116
-
117
-
118
-
119
-
120
-
121
-
122
-
123
-
124
-
125
-
126
-
127
-
128
-
129
-
130
-
131
-
132
-
133
-
134
-
135
-
136
-
137
-
138
-
139
-
140
-
141
-
142
-
143
-
144
-
145
-
146
-
147
-
148
-
149
-
150
-
151
-
152
-
153
-
154
-
155
-
156
-
157
-
158
-
159
-
160
-
161
-
162
-
163
-
164
-
165
-
166
-
167
-
168
-
169
-
170
-
171
-
172
-
173
-
174
-
175
-
176
-
177
-
178
-
179
-
180
-
181
-
182
-
183
-
184
-
185
-
186
-
187
-
188
-
189
-
190
-
191
-
192
-
193
-
194
-
195
-
196
-
197
-
198
-
199
-
200
-
201
-
202
-
203
-
204
-
205
-
206
-
207
-
208
-
209
-
210
-
211
-
212
-
213
-
214
-
215
-
216
-
217
-
218
-
219
-
220
-
221
-
222
-
223
-
224
-
225
-
226
-
227
-
228
-
229
-
230
-
231
-
232
-
233
-
234
-
235
-
236
-
237
-
238
-
239
-
240
-
241
-
242
-
243
-
244
-
245
-
246
-
247
-
248
-
249
-
250
-
251
-
252
-
253
-
254
-
255
-
256
-
257
-
258
-
259
-
260
-
261
-
262
-
263
-
264
-
265
-
266
-
267
-
268
-
269
-
270
-
271
-
272
-
273
-
274
-
275
-
276
-
277
-
278
-
279
-
280
-
281
-
282
-
283
-
284
-
285
-
286
-
287
-
288
-
289
-
290
-
291
-
292
 |
 |

SAKS INCORPORATED & SUBSIDIARIES
NOTES TO CONSOLIDATED FINANCIAL STATEMENTS—(Continued)
(In thousands, except per share amounts)
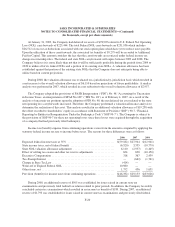
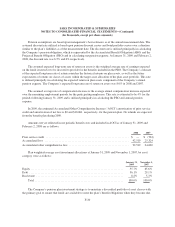
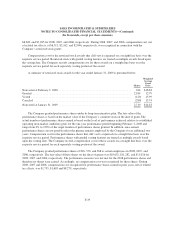
Pension assumptions are based upon management’s best estimates as of the annual measurement date. The
assumed discount rate utilized is based upon pension discount curves and bond portfolio curves over a duration
similar to the plan’s liabilities as of the measurement date. The discount rate is utilized principally in calculating
the Company’s pension obligation, which is represented by the Accumulated Benefit Obligation (ABO) and the
Projected Benefit Obligation (PBO) and in calculating net pension expense. At January 31, 2009 and February 2,
2008, the discount rate was 6.5% and 6% respectively.
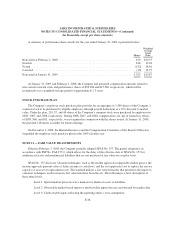
The assumed expected long-term rate of return on assets is the weighted average rate of earnings expected
on the funds invested or to be invested to provide for the benefits included in the PBO. The Company’s estimate
of the expected long-term rate of return considers the historical returns on plan assets, as well as the future
expectations of returns on classes of assets within the target asset allocation of the plan asset portfolio. This rate
is utilized principally in calculating the expected return on plan assets component of the Company’s annual
pension expense. The Company’s expected long-term rate of return on assets was 8.0% in 2008 and 2007.
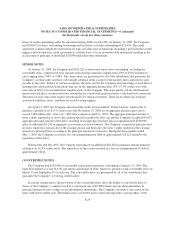
The assumed average rate of compensation increase is the average annual compensation increase expected
over the remaining employment periods for the participating employees. This rate is estimated to be 4% for the
periods following January 31, 2009 and is utilized principally in calculating the PBO and annual pension
expense.
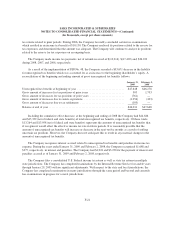
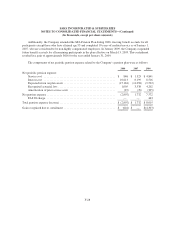
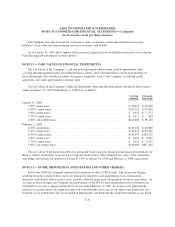
In 2009, the estimated Accumulated Other Comprehensive Income (“AOCI”) amortization of prior service
credit and amortization of net loss is $0 and $10,061, respectively, for the pension plan. No refunds are expected
from the benefit plan during 2009.
Amounts not yet reflected in net periodic benefit costs and included in AOCI as of January 31, 2009 and
February 2, 2008 are as follows:
2008 2007
Prior service credit .......................................................... $ — $ (704)
Accumulated loss ........................................................... 92,519 25,324
Accumulated other comprehensive loss .......................................... 92,519 24,620
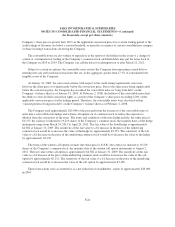
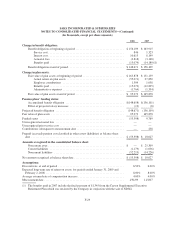
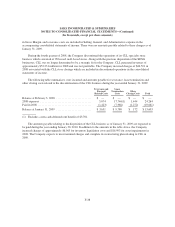
Plan weighted-average asset investment allocations at January 31, 2009 and November 1, 2007, by asset
category were as follows:
January 31,
2009
November 1,
2007
Equity ................................................................. 55.7% 65.6%
Debt .................................................................. 36.1% 29.1%
Real estate ............................................................. 8.2% 5.3%
Total .............................................................. 100.0% 100.0%
The Company’s pension plan investment strategy is to maintain a diversified portfolio of asset classes with
the primary goal to ensure that funds are available to meet the plan’s benefit obligations when they become due.
F-30