Saks Fifth Avenue 2008 Annual Report Download - page 27
Download and view the complete annual report
Please find page 27 of the 2008 Saks Fifth Avenue annual report below. You can navigate through the pages in the report by either clicking on the pages listed below, or by using the keyword search tool below to find specific information within the annual report.-
 1
1 -
2
-
3
-
4
-
5
-
6
-
7
-
8
-
9
-
10
-
11
-
12
-
13
-
14
-
15
-
16
-
 17
17 -
 18
18 -
 19
19 -
 20
20 -
 21
21 -
 22
22 -
 23
23 -
 24
24 -
 25
25 -
 26
26 -
 27
27 -
 28
28 -
 29
29 -
 30
30 -
 31
31 -
 32
32 -
 33
33 -
 34
34 -
 35
35 -
 36
36 -
 37
37 -
38
-
39
-
40
-
41
-
42
-
43
-
44
-
45
-
46
-
47
-
48
-
49
-
50
-
51
-
52
-
53
-
54
-
55
-
56
-
57
-
58
-
59
-
60
-
61
-
62
-
63
-
64
-
65
-
66
-
67
-
68
-
69
-
70
-
71
-
72
-
73
-
74
-
75
-
76
-
77
-
78
-
79
-
80
-
81
-
82
-
83
-
84
-
85
-
86
-
87
-
88
-
89
-
90
-
91
-
92
-
93
-
94
-
95
-
96
-
97
-
98
-
99
-
100
-
101
-
102
-
103
-
104
-
105
-
106
-
107
-
108
-
109
-
110
-
111
-
112
-
113
-
114
-
115
-
116
-
117
-
118
-
119
-
120
-
121
-
122
-
123
-
124
-
125
-
126
-
127
-
128
-
129
-
130
-
131
-
132
-
133
-
134
-
135
-
136
-
137
-
138
-
139
-
140
-
141
-
142
-
143
-
144
-
145
-
146
-
147
-
148
-
149
-
150
-
151
-
152
-
153
-
154
-
155
-
156
-
157
-
158
-
159
-
160
-
161
-
162
-
163
-
164
-
165
-
166
-
167
-
168
-
169
-
170
-
171
-
172
-
173
-
174
-
175
-
176
-
177
-
178
-
179
-
180
-
181
-
182
-
183
-
184
-
185
-
186
-
187
-
188
-
189
-
190
-
191
-
192
-
193
-
194
-
195
-
196
-
197
-
198
-
199
-
200
-
201
-
202
-
203
-
204
-
205
-
206
-
207
-
208
-
209
-
210
-
211
-
212
-
213
-
214
-
215
-
216
-
217
-
218
-
219
-
220
-
221
-
222
-
223
-
224
-
225
-
226
-
227
-
228
-
229
-
230
-
231
-
232
-
233
-
234
-
235
-
236
-
237
-
238
-
239
-
240
-
241
-
242
-
243
-
244
-
245
-
246
-
247
-
248
-
249
-
250
-
251
-
252
-
253
-
254
-
255
-
256
-
257
-
258
-
259
-
260
-
261
-
262
-
263
-
264
-
265
-
266
-
267
-
268
-
269
-
270
-
271
-
272
-
273
-
274
-
275
-
276
-
277
-
278
-
279
-
280
-
281
-
282
-
283
-
284
-
285
-
286
-
287
-
288
-
289
-
290
-
291
-
292
 |
 |
300 basis point improvement in the expense rate as a percentage of sales. Additionally, the gross margin rate
improved 40 basis points for the year ended February 2, 2008. The improvement in gross margin dollars and the
gross margin rate was principally attributable to the higher sales driven by the strengthening of merchandise
assortments by store and enhancements to the merchandise planning and allocation process.
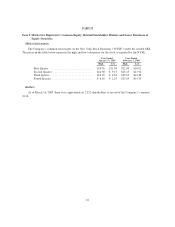
NET SALES
For the year ended February 2, 2008, total sales increased 11.6% to $3,224.1 million from $2,888.4 million
for the year ended February 3, 2007. The fiscal year ended February 3, 2007 included an extra week, creating a
53-week fiscal year that occurs every six years in the accounting cycle for many retailers which accounted for an
additional $42.7 million in sales. Consolidated comparable store sales increased $332.9 million, or 11.9% from
$2,805.3 million for the 52-week period ended January 27, 2007 to $3,138.2 million at February 2, 2008. The
previously mentioned 53rd week has been excluded from the comparable store sales calculation.
GROSS MARGIN
For the year ended February 2, 2008, gross margin was $1,251.8 million, or 38.8% of net sales, compared to
$1,108.3 million, or 38.4% of net sales, for the year ended February 3, 2007. The improvement in gross margin
dollars and gross margin rate was principally attributable to the higher sales driven by the strengthening of
merchandise assortments by store and enhancements to the merchandise planning and allocation process.
SELLING, GENERAL AND ADMINISTRATIVE EXPENSES
For the year ended February 2, 2008, SG&A was $827.6 million, or 25.7% of net sales, compared to $799.3
million, or 27.7% of net sales, for the year ended February 3, 2007. The net increase of $28.3 million in expenses
was primarily driven by higher variable expenses associated with the year over year sales increase of $335.6
million. The fiscal 2006 period included a $33.4 million charge associated with the anti-dilution adjustment made
to outstanding options related to the Company’s $4 per share dividend paid on May 1, 2006 and the $4 per share
dividend paid on November 30, 2006. As a percentage of sales, SG&A decreased by 200 basis points from the
year ended February 3, 2007; however, excluding the anti-dilution adjustment noted above, SG&A expense as a
percentage of sales declined 80 basis points over the same period.
Amounts received from vendors in conjunction with compensation programs and cooperative advertising
were consistent with the related gross compensation and cooperative advertising expenditures and therefore had
no impact on SG&A expense, in dollars or as a percentage of net sales.
OTHER OPERATING EXPENSES
For the year ended February 2, 2008, other operating expenses were $317.0 million, or 9.8% of net sales,
compared to $312.5 million, or 10.8% of net sales, for the year ended February 3, 2007. The increase of $4.5
million was principally driven by higher depreciation and amortization expense of $5.9 million and an increase in
taxes other than income taxes of $5.9 million. This is partially offset by a decrease in property and equipment
rentals of $7.5 million for the year ended February 2, 2008. As a percentage of sales, other operating expenses
decreased slightly, reflecting the ability to leverage expenses as store sales increased.
IMPAIRMENTS AND DISPOSITIONS
For the year ended February 2, 2008, the Company recognized net charges from impairments and
dispositions of $4.3 million compared to net charges of $11.8 million for the year ended February 3, 2007. The
current and prior year net charges were primarily due to asset impairments in the normal course of business.
26