Saks Fifth Avenue 2008 Annual Report Download - page 57
Download and view the complete annual report
Please find page 57 of the 2008 Saks Fifth Avenue annual report below. You can navigate through the pages in the report by either clicking on the pages listed below, or by using the keyword search tool below to find specific information within the annual report.-
 1
1 -
2
-
3
-
4
-
5
-
6
-
7
-
8
-
9
-
10
-
11
-
12
-
13
-
14
-
15
-
16
-
17
-
18
-
19
-
20
-
21
-
22
-
23
-
24
-
25
-
26
-
27
-
28
-
29
-
30
-
31
-
32
-
33
-
34
-
35
-
36
-
37
-
38
-
39
-
40
-
41
-
42
-
43
-
44
-
45
-
46
-
 47
47 -
 48
48 -
 49
49 -
 50
50 -
 51
51 -
 52
52 -
 53
53 -
 54
54 -
 55
55 -
 56
56 -
 57
57 -
 58
58 -
 59
59 -
 60
60 -
 61
61 -
 62
62 -
 63
63 -
 64
64 -
 65
65 -
 66
66 -
 67
67 -
68
-
69
-
70
-
71
-
72
-
73
-
74
-
75
-
76
-
77
-
78
-
79
-
80
-
81
-
82
-
83
-
84
-
85
-
86
-
87
-
88
-
89
-
90
-
91
-
92
-
93
-
94
-
95
-
96
-
97
-
98
-
99
-
100
-
101
-
102
-
103
-
104
-
105
-
106
-
107
-
108
-
109
-
110
-
111
-
112
-
113
-
114
-
115
-
116
-
117
-
118
-
119
-
120
-
121
-
122
-
123
-
124
-
125
-
126
-
127
-
128
-
129
-
130
-
131
-
132
-
133
-
134
-
135
-
136
-
137
-
138
-
139
-
140
-
141
-
142
-
143
-
144
-
145
-
146
-
147
-
148
-
149
-
150
-
151
-
152
-
153
-
154
-
155
-
156
-
157
-
158
-
159
-
160
-
161
-
162
-
163
-
164
-
165
-
166
-
167
-
168
-
169
-
170
-
171
-
172
-
173
-
174
-
175
-
176
-
177
-
178
-
179
-
180
-
181
-
182
-
183
-
184
-
185
-
186
-
187
-
188
-
189
-
190
-
191
-
192
-
193
-
194
-
195
-
196
-
197
-
198
-
199
-
200
-
201
-
202
-
203
-
204
-
205
-
206
-
207
-
208
-
209
-
210
-
211
-
212
-
213
-
214
-
215
-
216
-
217
-
218
-
219
-
220
-
221
-
222
-
223
-
224
-
225
-
226
-
227
-
228
-
229
-
230
-
231
-
232
-
233
-
234
-
235
-
236
-
237
-
238
-
239
-
240
-
241
-
242
-
243
-
244
-
245
-
246
-
247
-
248
-
249
-
250
-
251
-
252
-
253
-
254
-
255
-
256
-
257
-
258
-
259
-
260
-
261
-
262
-
263
-
264
-
265
-
266
-
267
-
268
-
269
-
270
-
271
-
272
-
273
-
274
-
275
-
276
-
277
-
278
-
279
-
280
-
281
-
282
-
283
-
284
-
285
-
286
-
287
-
288
-
289
-
290
-
291
-
292
 |
 |

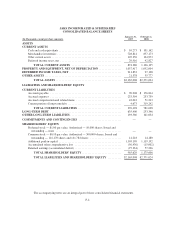
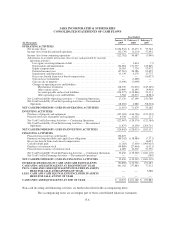
SAKS INCORPORATED & SUBSIDIARIES
CONSOLIDATED STATEMENTS OF INCOME
(In Thousands, except per share amounts)
Year Ended
January 31,
2009
February 2,
2008
February 3,
2007
NET SALES ............................................. $3,029,743 $3,224,076 $2,888,427
Cost of sales (excluding depreciation and amortization) ........... 2,062,494 1,972,251 1,780,127
Gross margin ......................................... 967,249 1,251,825 1,108,300
Selling, general and administrative expenses .................... 770,815 827,624 799,292
Other operating expenses
Property and equipment rentals ........................... 101,063 100,106 107,645
Depreciation and amortization ........................... 134,694 131,737 125,849
Taxes other than income taxes ........................... 82,598 84,496 78,584
Store pre-opening costs ................................. 2,328 707 408
Impairments and dispositions ................................ 11,139 4,279 11,775
OPERATING INCOME (LOSS) .................... (135,388) 102,876 (15,253)
Interest expense ........................................... (39,306) (42,314) (50,136)
Gain (loss) on extinguishment of debt ......................... — (5,634) 7
Other income, net ......................................... 5,600 24,912 28,407
INCOME (LOSS) FROM CONTINUING
OPERATIONS BEFORE INCOME TAXES ........ (169,094) 79,840 (36,975)
Provision (benefit) for income taxes ........................... (46,332) 29,153 (33,026)
INCOME (LOSS) FROM CONTINUING
OPERATIONS ................................ (122,762) 50,687 (3,949)
DISCONTINUED OPERATIONS:
Income (loss) from discontinued operations (including gain on
disposal of $0, $0, and $191,918, respectively) ................ (52,727) (4,860) 188,227
Provision (benefit) for income taxes ........................... (20,548) (1,646) 130,536
INCOME (LOSS) FROM DISCONTINUED
OPERATIONS ................................ (32,179) (3,214) 57,691
NET INCOME (LOSS) .................................... $ (154,941) $ 47,473 $ 53,742
Per share amounts — Basic
Income (loss) from continuing operations ...................... $ (0.89) $ 0.36 $ (0.03)
Income (loss) from discontinued operations ..................... $ (0.23) $ (0.02) $ 0.43
Net income (loss) ......................................... $ (1.12) $ 0.34 $ 0.40
Per share amounts — Diluted
Income (loss) from continuing operations ...................... $ (0.89) $ 0.33 $ (0.03)
Income (loss) from discontinued operations ..................... $ (0.23) $ (0.02) $ 0.43
Net income (loss) ......................................... $ (1.12) $ 0.31 $ 0.40
Weighted average common shares:
Basic ............................................... 138,384 140,402 135,880
Diluted .............................................. 138,384 153,530 135,880
The accompanying notes are an integral part of these consolidated financial statements.
F-3