Saks Fifth Avenue 2008 Annual Report Download - page 18
Download and view the complete annual report
Please find page 18 of the 2008 Saks Fifth Avenue annual report below. You can navigate through the pages in the report by either clicking on the pages listed below, or by using the keyword search tool below to find specific information within the annual report.-
 1
1 -
2
-
3
-
4
-
5
-
6
-
7
-
 8
8 -
 9
9 -
 10
10 -
 11
11 -
 12
12 -
 13
13 -
 14
14 -
 15
15 -
 16
16 -
 17
17 -
 18
18 -
 19
19 -
 20
20 -
 21
21 -
 22
22 -
 23
23 -
 24
24 -
 25
25 -
 26
26 -
 27
27 -
 28
28 -
29
-
30
-
31
-
32
-
33
-
34
-
35
-
36
-
37
-
38
-
39
-
40
-
41
-
42
-
43
-
44
-
45
-
46
-
47
-
48
-
49
-
50
-
51
-
52
-
53
-
54
-
55
-
56
-
57
-
58
-
59
-
60
-
61
-
62
-
63
-
64
-
65
-
66
-
67
-
68
-
69
-
70
-
71
-
72
-
73
-
74
-
75
-
76
-
77
-
78
-
79
-
80
-
81
-
82
-
83
-
84
-
85
-
86
-
87
-
88
-
89
-
90
-
91
-
92
-
93
-
94
-
95
-
96
-
97
-
98
-
99
-
100
-
101
-
102
-
103
-
104
-
105
-
106
-
107
-
108
-
109
-
110
-
111
-
112
-
113
-
114
-
115
-
116
-
117
-
118
-
119
-
120
-
121
-
122
-
123
-
124
-
125
-
126
-
127
-
128
-
129
-
130
-
131
-
132
-
133
-
134
-
135
-
136
-
137
-
138
-
139
-
140
-
141
-
142
-
143
-
144
-
145
-
146
-
147
-
148
-
149
-
150
-
151
-
152
-
153
-
154
-
155
-
156
-
157
-
158
-
159
-
160
-
161
-
162
-
163
-
164
-
165
-
166
-
167
-
168
-
169
-
170
-
171
-
172
-
173
-
174
-
175
-
176
-
177
-
178
-
179
-
180
-
181
-
182
-
183
-
184
-
185
-
186
-
187
-
188
-
189
-
190
-
191
-
192
-
193
-
194
-
195
-
196
-
197
-
198
-
199
-
200
-
201
-
202
-
203
-
204
-
205
-
206
-
207
-
208
-
209
-
210
-
211
-
212
-
213
-
214
-
215
-
216
-
217
-
218
-
219
-
220
-
221
-
222
-
223
-
224
-
225
-
226
-
227
-
228
-
229
-
230
-
231
-
232
-
233
-
234
-
235
-
236
-
237
-
238
-
239
-
240
-
241
-
242
-
243
-
244
-
245
-
246
-
247
-
248
-
249
-
250
-
251
-
252
-
253
-
254
-
255
-
256
-
257
-
258
-
259
-
260
-
261
-
262
-
263
-
264
-
265
-
266
-
267
-
268
-
269
-
270
-
271
-
272
-
273
-
274
-
275
-
276
-
277
-
278
-
279
-
280
-
281
-
282
-
283
-
284
-
285
-
286
-
287
-
288
-
289
-
290
-
291
-
292
 |
 |
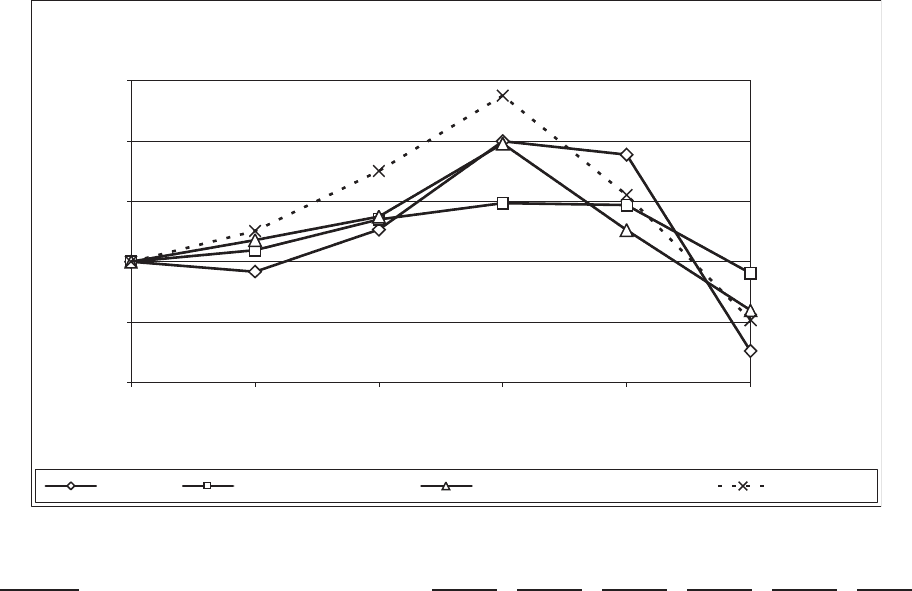
Performance Graph
The following graph and table compare cumulative total shareholder return among the Company, the S&P
Midcap 400 Index, the S&P 500 Department Stores Index, and a Retail Peer Group Index (weighted by market
capitalization and consisting of Dillard’s, Inc.; Macy’s, Inc.; Nordstrom, Inc.; J.C. Penney Company, Inc.; and,
through the fiscal year ended January 29, 2005, The May Department Stores Company and The Neiman Marcus
Group, Inc., both of which were acquired in 2005 and are no longer public companies) assuming an initial
investment of $100 and reinvestment of dividends.
COMPARISON OF CUMULATIVE FIVE YEAR TOTAL RETURN
SAKS INC S&P MIDCAP 400 INDEX S&P 500 DEPARTMENT STORES PEER GROUP
1/31/04 1/29/05 1/28/06 2/3/07 2/2/08 1/31/09
$0
$50
$100
$150
$200
$250
Description
Starting
Basis
1/31/04 1/29/05 1/28/06 2/3/07 2/2/08 1/31/09
Saks Incorporated .......................... $100.00 $ 91.84 $126.51 $199.93 $188.62 $25.92
S&P Midcap 400 ........................... $100.00 $109.50 $134.89 $148.45 $146.80 $90.41
S&P 500 Department Stores .................. $100.00 $117.76 $137.50 $197.75 $126.26 $59.64
Retail Peer Group .......................... $100.00 $125.52 $175.12 $237.74 $155.29 $51.71
This “Performance Graph” section shall not be deemed to be “soliciting material” or to be “filed” with the
SEC or subject to Regulation 14A or 14C, or to the liabilities of Section 18 of the Securities Exchange Act of
1934, as amended (the “Exchange Act”).
Dividends
During the fiscal years ended January 31, 2009 and February 2, 2008, the Company did not declare any
dividends. Future dividends, if any, will be determined by the Company’s Board of Directors in light of
circumstances then existing, including earnings, financial requirements, and general business conditions. The
Company does not anticipate declaring dividends in the foreseeable future.
17