Saks Fifth Avenue 2008 Annual Report Download - page 101
Download and view the complete annual report
Please find page 101 of the 2008 Saks Fifth Avenue annual report below. You can navigate through the pages in the report by either clicking on the pages listed below, or by using the keyword search tool below to find specific information within the annual report.-
 1
1 -
2
-
3
-
4
-
5
-
6
-
7
-
8
-
9
-
10
-
11
-
12
-
13
-
14
-
15
-
16
-
17
-
18
-
19
-
20
-
21
-
22
-
23
-
24
-
25
-
26
-
27
-
28
-
29
-
30
-
31
-
32
-
33
-
34
-
35
-
36
-
37
-
38
-
39
-
40
-
41
-
42
-
43
-
44
-
45
-
46
-
47
-
48
-
49
-
50
-
51
-
52
-
53
-
54
-
55
-
56
-
57
-
58
-
59
-
60
-
61
-
62
-
63
-
64
-
65
-
66
-
67
-
68
-
69
-
70
-
71
-
72
-
73
-
74
-
75
-
76
-
77
-
78
-
79
-
80
-
81
-
82
-
83
-
84
-
85
-
86
-
87
-
88
-
89
-
90
-
 91
91 -
 92
92 -
 93
93 -
 94
94 -
 95
95 -
 96
96 -
 97
97 -
 98
98 -
 99
99 -
 100
100 -
 101
101 -
 102
102 -
 103
103 -
 104
104 -
 105
105 -
 106
106 -
 107
107 -
 108
108 -
 109
109 -
 110
110 -
 111
111 -
112
-
113
-
114
-
115
-
116
-
117
-
118
-
119
-
120
-
121
-
122
-
123
-
124
-
125
-
126
-
127
-
128
-
129
-
130
-
131
-
132
-
133
-
134
-
135
-
136
-
137
-
138
-
139
-
140
-
141
-
142
-
143
-
144
-
145
-
146
-
147
-
148
-
149
-
150
-
151
-
152
-
153
-
154
-
155
-
156
-
157
-
158
-
159
-
160
-
161
-
162
-
163
-
164
-
165
-
166
-
167
-
168
-
169
-
170
-
171
-
172
-
173
-
174
-
175
-
176
-
177
-
178
-
179
-
180
-
181
-
182
-
183
-
184
-
185
-
186
-
187
-
188
-
189
-
190
-
191
-
192
-
193
-
194
-
195
-
196
-
197
-
198
-
199
-
200
-
201
-
202
-
203
-
204
-
205
-
206
-
207
-
208
-
209
-
210
-
211
-
212
-
213
-
214
-
215
-
216
-
217
-
218
-
219
-
220
-
221
-
222
-
223
-
224
-
225
-
226
-
227
-
228
-
229
-
230
-
231
-
232
-
233
-
234
-
235
-
236
-
237
-
238
-
239
-
240
-
241
-
242
-
243
-
244
-
245
-
246
-
247
-
248
-
249
-
250
-
251
-
252
-
253
-
254
-
255
-
256
-
257
-
258
-
259
-
260
-
261
-
262
-
263
-
264
-
265
-
266
-
267
-
268
-
269
-
270
-
271
-
272
-
273
-
274
-
275
-
276
-
277
-
278
-
279
-
280
-
281
-
282
-
283
-
284
-
285
-
286
-
287
-
288
-
289
-
290
-
291
-
292
 |
 |

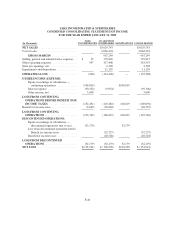
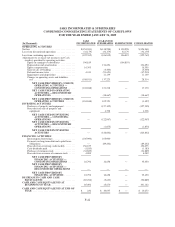
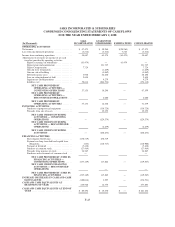
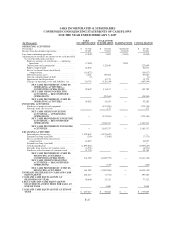
SAKS INCORPORATED & SUBSIDIARIES
CONDENSED CONSOLIDATING STATEMENTS OF CASH FLOWS
FOR THE YEAR ENDED FEBRUARY 3, 2007
(In Thousands)
SAKS
INCORPORATED
GUARANTOR
SUBSIDIARIES ELIMINATIONS CONSOLIDATED
OPERATING ACTIVITIES
Net income .................................... $ 53,742 $ 65,184 $(65,184) $ 53,742
Income from discontinued operations ................ 57,691 57,691 (57,691) 57,691
Loss from continuing operations ................... (3,949) 7,493 (7,493) (3,949)
Adjustments to reconcile net income to net cash provided
by (used in) operating activities:
Equity in earnings of subsidiaries — continuing
operations ............................... (7,493) 7,493
Depreciation and amortization ................. 125,849 125,849
Equity compensation ........................ 52,072 52,072
Excess tax benefit from stock-based
compensation ............................ (16,027) (16,027)
Deferred income taxes ....................... 4,241 89,384 93,625
Gain on extinguishment of debt ................ (7) (7)
Impairments and dispositions .................. 11,775 11,775
Changes in operating assets and liabilities, net ..... 10,795 (120,344) (109,549)
NET CASH PROVIDED BY (USED IN)
OPERATING ACTIVITIES —
CONTINUING OPERATIONS ........ 39,632 114,157 — 153,789
NET CASH USED IN OPERATING
ACTIVITIES — DISCONTINUED
OPERATIONS ...................... (98,504) (98,504)
NET CASH PROVIDED BY (USED IN)
OPERATING ACTIVITIES ........... 39,632 15,653 — 55,285
INVESTING ACTIVITIES
Purchases of property and equipment ............ (121,355) (121,355)
Proceeds from sale of assets ................... 171 171
NET CASH USED IN INVESTING
ACTIVITIES — CONTINUING
OPERATIONS ...................... — (121,184) — (121,184)
NET CASH PROVIDED BY INVESTING
ACTIVITIES — DISCONTINUED
OPERATIONS ...................... 1,304,701 1,304,701
NET CASH PROVIDED BY INVESTING
ACTIVITIES ........................ — 1,183,517 — 1,183,517
FINANCING ACTIVITIES
Intercompany borrowings ..................... 1,195,647 (1,195,647) —
Payments on long-term debt ................... (263) (7,108) (7,371)
Excess tax benefit from stock based
compensation ............................ 16,027 16,027
Payments on long-term debt ................... —
Cash dividends paid ......................... (1,095,025) (1,095,025)
Proceeds from issuance of common stock ........ (6,531) (6,531)
Purchases and retirements of common stock ...... 51,730 51,730
NET CASH PROVIDED BY (USED IN)
FINANCING ACTIVITIES —
CONTINUING OPERATIONS ........ 161,585 (1,202,755) — (1,041,170)
NET CASH USED IN FINANCING
ACTIVITIES — DISCONTINUED
OPERATIONS ...................... (149) (149)
NET CASH PROVIDED BY (USED IN)
FINANCING ACTIVITIES ............ 161,585 (1,202,904) — (1,041,319)
INCREASE (DECREASE) IN CASH AND CASH
EQUIVALENTS ............................. 201,217 (3,734) — 197,483
CASH AND CASH EQUIVALENTS AT
BEGINNING OF YEAR ...................... 46,000 31,312 77,312
LESS: CASH AND CASH EQUIVALENTS
INCLUDED IN ASSETS HELD FOR SALE AT
END OF YEAR .............................. 3,088 3,088
CASH AND CASH EQUIVALENTS AT END OF
YEAR ...................................... $ 247,217 $ 30,666 $ — $ 277,883
F-47