Saks Fifth Avenue 2008 Annual Report Download - page 81
Download and view the complete annual report
Please find page 81 of the 2008 Saks Fifth Avenue annual report below. You can navigate through the pages in the report by either clicking on the pages listed below, or by using the keyword search tool below to find specific information within the annual report.-
 1
1 -
2
-
3
-
4
-
5
-
6
-
7
-
8
-
9
-
10
-
11
-
12
-
13
-
14
-
15
-
16
-
17
-
18
-
19
-
20
-
21
-
22
-
23
-
24
-
25
-
26
-
27
-
28
-
29
-
30
-
31
-
32
-
33
-
34
-
35
-
36
-
37
-
38
-
39
-
40
-
41
-
42
-
43
-
44
-
45
-
46
-
47
-
48
-
49
-
50
-
51
-
52
-
53
-
54
-
55
-
56
-
57
-
58
-
59
-
60
-
61
-
62
-
63
-
64
-
65
-
66
-
67
-
68
-
69
-
70
-
 71
71 -
 72
72 -
 73
73 -
 74
74 -
 75
75 -
 76
76 -
 77
77 -
 78
78 -
 79
79 -
 80
80 -
 81
81 -
 82
82 -
 83
83 -
 84
84 -
 85
85 -
 86
86 -
 87
87 -
 88
88 -
 89
89 -
 90
90 -
 91
91 -
92
-
93
-
94
-
95
-
96
-
97
-
98
-
99
-
100
-
101
-
102
-
103
-
104
-
105
-
106
-
107
-
108
-
109
-
110
-
111
-
112
-
113
-
114
-
115
-
116
-
117
-
118
-
119
-
120
-
121
-
122
-
123
-
124
-
125
-
126
-
127
-
128
-
129
-
130
-
131
-
132
-
133
-
134
-
135
-
136
-
137
-
138
-
139
-
140
-
141
-
142
-
143
-
144
-
145
-
146
-
147
-
148
-
149
-
150
-
151
-
152
-
153
-
154
-
155
-
156
-
157
-
158
-
159
-
160
-
161
-
162
-
163
-
164
-
165
-
166
-
167
-
168
-
169
-
170
-
171
-
172
-
173
-
174
-
175
-
176
-
177
-
178
-
179
-
180
-
181
-
182
-
183
-
184
-
185
-
186
-
187
-
188
-
189
-
190
-
191
-
192
-
193
-
194
-
195
-
196
-
197
-
198
-
199
-
200
-
201
-
202
-
203
-
204
-
205
-
206
-
207
-
208
-
209
-
210
-
211
-
212
-
213
-
214
-
215
-
216
-
217
-
218
-
219
-
220
-
221
-
222
-
223
-
224
-
225
-
226
-
227
-
228
-
229
-
230
-
231
-
232
-
233
-
234
-
235
-
236
-
237
-
238
-
239
-
240
-
241
-
242
-
243
-
244
-
245
-
246
-
247
-
248
-
249
-
250
-
251
-
252
-
253
-
254
-
255
-
256
-
257
-
258
-
259
-
260
-
261
-
262
-
263
-
264
-
265
-
266
-
267
-
268
-
269
-
270
-
271
-
272
-
273
-
274
-
275
-
276
-
277
-
278
-
279
-
280
-
281
-
282
-
283
-
284
-
285
-
286
-
287
-
288
-
289
-
290
-
291
-
292
 |
 |
SAKS INCORPORATED & SUBSIDIARIES
NOTES TO CONSOLIDATED FINANCIAL STATEMENTS—(Continued)
(In thousands, except per share amounts)
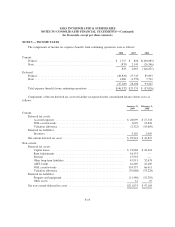
the allocation of income among various tax jurisdictions. Based on annual evaluations of tax filing positions, the
Company believes it has adequately accrued for its income tax exposures. To the extent the Company were to
prevail in matters for which accruals have been established or be required to pay amounts in excess of the current
reserves, the Company’s effective tax rate in a given financial statement period may be materially impacted. At
January 31, 2009 certain state examinations were ongoing.
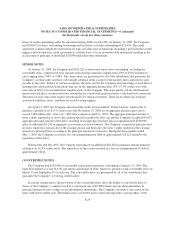
NOTE 8 — EMPLOYEE BENEFIT PLANS
DEFERRED COMPENSATION PLAN
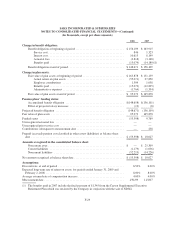
The Company sponsors a non-qualified deferred compensation plan wherein eligible employees can defer a
portion of their compensation or unvested restricted stock and allocate the deferrals to a choice of investments
options. The liability for compensation deferred under this plan was $10,267 and $19,417 for the years ended
January 31, 2009 and February 2, 2008, respectively. The Company manages the risk of changes in the fair value
of the liability for deferred compensation by electing to match its liability under the plan with investment
vehicles that offset a substantial portion of its exposure. The cash value of the investment vehicles was $9,701
and $18,886 for the years ended January 31, 2009 and February 2, 2008, respectively, and is included in Other
Assets in the accompanying consolidated balance sheets.
EMPLOYEE SAVINGS PLANS
The Company sponsors various qualified savings plans that cover substantially all full-time employees.
Company contributions charged to expense under these plans for 2008, 2007, and 2006 were $7,805, $8,403, and
$7,282, respectively. The Company’s contributions to the plan have been suspended for the 2009 calendar year.
At January 31, 2009, total assets invested by participants related to the employee savings plans was $340,678, of
which approximately 1% was invested in the Company’s stock at the discretion of the participating employees.
DEFINED BENEFIT PLANS
The Company sponsors a defined benefit cash balance pension plan for many employees of the Company. In
conjunction with the sale of NDSG, the Company sold to Bon-Ton the assets, and Bon-Ton assumed the
liabilities, of the Carson cash balance pension plan. The Company generally funds pension costs, currently
subject to regulatory funding requirements. The Company expects funding requirements of up to $1,000 in 2009.
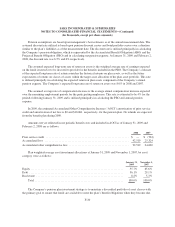
In September 2006, the FASB issued SFAS No. 158, which requires employers to (i) recognize the funded
status of their defined benefit pension and other postretirement plans on the consolidated balance sheet,
(ii) recognize as a component of other comprehensive income, net of tax, the gains or losses and prior service
costs or credits that arise during the period but are not recognized as components of net periodic benefit cost and
(iii) measure defined benefit plan assets and obligations as of the date of the employer’s statement of financial
position. The Company adopted the recognition and disclosure requirements of SFAS No. 158 prospectively on
February 3, 2007. Effective January 31, 2009, in accordance with SFAS No. 158, the Company changed its
measurement date from November 1 to the date of its fiscal year end. The Company elected to adopt the change
in measurement date using the alternative transition method. In accordance with the alternative transition method,
the actuarial valuation provided a 15-month projection of net periodic benefit cost to January 31, 2009 that
resulted in a $344 decrease to 2008 ending retained earnings.
F-27