Qantas 2005 Annual Report Download - page 77
Download and view the complete annual report
Please find page 77 of the 2005 Qantas annual report below. You can navigate through the pages in the report by either clicking on the pages listed below, or by using the keyword search tool below to find specific information within the annual report.-
 1
1 -
2
-
3
-
4
-
5
-
6
-
7
-
8
-
9
-
10
-
11
-
12
-
13
-
14
-
15
-
16
-
17
-
18
-
19
-
20
-
21
-
22
-
23
-
24
-
25
-
26
-
27
-
28
-
29
-
30
-
31
-
32
-
33
-
34
-
35
-
36
-
37
-
38
-
39
-
40
-
41
-
42
-
43
-
44
-
45
-
46
-
47
-
48
-
49
-
50
-
51
-
52
-
53
-
54
-
55
-
56
-
57
-
58
-
59
-
60
-
61
-
62
-
63
-
64
-
65
-
66
-
 67
67 -
 68
68 -
 69
69 -
 70
70 -
 71
71 -
 72
72 -
 73
73 -
 74
74 -
 75
75 -
 76
76 -
 77
77 -
 78
78 -
 79
79 -
 80
80 -
 81
81 -
 82
82 -
 83
83 -
 84
84 -
 85
85 -
 86
86 -
 87
87 -
88
-
89
-
90
-
91
-
92
-
93
-
94
-
95
-
96
-
97
-
98
-
99
-
100
-
101
-
102
-
103
-
104
-
105
-
106
-
107
-
108
-
109
-
110
-
111
-
112
-
113
-
114
-
115
-
116
-
117
-
118
-
119
-
120
-
121
-
122
-
123
-
124
-
125
-
126
-
127
-
128
 |
 |

75
Qantas Annual Report 2005
~Notes to the Financial Statements~
for the year ended 30 June 2005
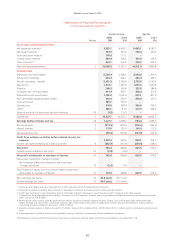
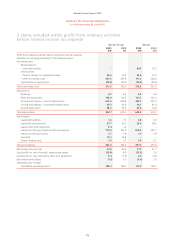
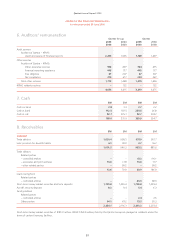
3. Items included within profit from ordinary activities
before related income tax expense
Qantas Group Qantas
2005
$M
2004
$M
2005
$M
2004
$M
Profit from ordinary activities before related income tax expense
includes the charging/(crediting) of the following items:
Borrowing costs
Related parties
– controlled entities ––84.1 72.9
Other parties
– finance charges on capitalised leases 34.6 16.9 35.4 15.2
– other borrowing costs 251.3 291.8 171.2 224.6
Capitalised borrowing costs (74.4) (49.2) (74.4) (49.2)
Total borrowing costs 211.5 259.5 216.3 263.5
Depreciation
Buildings 6.7 6.2 4.6 4.4
Plant and equipment 134.9 120.5 121.1 102.3
Aircraft and engines – normal depreciation 612.5 409.8 455.7 375.2
Aircraft and engines – accelerated depreciation 45.1 61.4 45.1 61.4
Aircraft spare parts 48.5 75.4 42.9 70.8
Total depreciation 847.7 673.3 669.4 614.1
Amortisation
Leasehold buildings 1.6 7.1 0.8 0.9
Leasehold improvements 57.7 50.0 33.0 28.5
Leased plant and equipment 0.4 1.4 ––
Leased and hire purchased aircraft and engines 173.9 257.5 254.3 225.7
Leased aircraft spare parts 1.7 1.8 1.7 1.8
Goodwill 15.1 14.4 ––
Airport landing slots 1.9 0.1 1.9 0.1
Total amortisation 252.3 332.3 291.7 257.0
Net foreign currency loss 21.8 40.9 11.7 31.7
Loss/(profit) on sale of aircraft, engines and spares (13.0) 4.0 (12.2) 3.0
Loss/(profit) on sale of property, plant and equipment 3.4 (3.5) 2.4 (2.5)
Bad and doubtful debts (1.1) 3.0 (1.4) 3.0
Operating lease charges
Cancellable operating leases 148.2 166.3 127.2 162.1