Qantas 2005 Annual Report Download - page 110
Download and view the complete annual report
Please find page 110 of the 2005 Qantas annual report below. You can navigate through the pages in the report by either clicking on the pages listed below, or by using the keyword search tool below to find specific information within the annual report.-
 1
1 -
2
-
3
-
4
-
5
-
6
-
7
-
8
-
9
-
10
-
11
-
12
-
13
-
14
-
15
-
16
-
17
-
18
-
19
-
20
-
21
-
22
-
23
-
24
-
25
-
26
-
27
-
28
-
29
-
30
-
31
-
32
-
33
-
34
-
35
-
36
-
37
-
38
-
39
-
40
-
41
-
42
-
43
-
44
-
45
-
46
-
47
-
48
-
49
-
50
-
51
-
52
-
53
-
54
-
55
-
56
-
57
-
58
-
59
-
60
-
61
-
62
-
63
-
64
-
65
-
66
-
67
-
68
-
69
-
70
-
71
-
72
-
73
-
74
-
75
-
76
-
77
-
78
-
79
-
80
-
81
-
82
-
83
-
84
-
85
-
86
-
87
-
88
-
89
-
90
-
91
-
92
-
93
-
94
-
95
-
96
-
97
-
98
-
99
-
 100
100 -
 101
101 -
 102
102 -
 103
103 -
 104
104 -
 105
105 -
 106
106 -
 107
107 -
 108
108 -
 109
109 -
 110
110 -
 111
111 -
 112
112 -
 113
113 -
 114
114 -
 115
115 -
 116
116 -
 117
117 -
 118
118 -
 119
119 -
 120
120 -
121
-
122
-
123
-
124
-
125
-
126
-
127
-
128
 |
 |

108
Spirit of Australia
~Notes to the Financial Statements~
for the year ended 30 June 2005
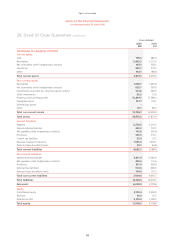
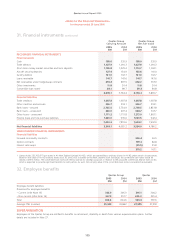
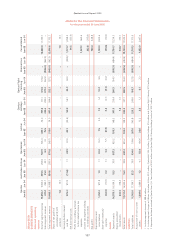
34. Segment information continued
Passenger, freight and other services revenue from domestic services within Australia is attributed to the Australian geographic region.
Passenger, freight and other services revenue from inbound and outbound services between Australia and overseas is allocated
proportionately to the area in which the sale was made. Other operating revenue is not allocated to a geographic region as it is
impractical to do so.
Qantas Group
2005
$M
2004
$M
ANALYSIS OF TOTAL REVENUE BY GEOGRAPHIC REGION
Sales and operating revenue
Passenger, freight and other services revenue
Australia 7, 253.4 6,696.5
United Kingdom and Europe 926.1 839.7
Japan 453.4 426.9
South-East Asia/North-East Asia 377.4 342.3
The Americas and the Pacific 886.6 820.3
New Zealand 390.3 368.4
Other regions 340.3 221.6
10,627.5 9,715.7
Other operating revenue
Tours and travel revenue 707.8 711.1
Contract work revenue 484.9 502.6
Other unallocated revenue 828.6 424.3
Sales and operating revenue 12,648.8 11, 353.7
Revenue from outside operating activities
Interest revenue 117.0 125.9
Proceeds from sale of property, plant and equipment 71.5 50.1
Proceeds from sale and leaseback of non-current assets 257.9 171.7
Total revenue from outside operating activities 446.4 347.7
Total revenue from ordinary activities 13,095.2 11,701.4
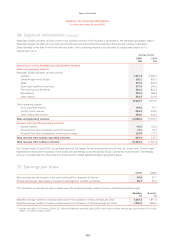
For the year ended 30 June 2005, the principal assets of the Qantas Group comprised the aircraft fleet, all, except nine, of which were
registered and domiciled in Australia. These assets are used flexibly across the Qantas Group’s worldwide route network. Accordingly,
there is no suitable basis for allocating such assets and the related liabilities between geographic areas.
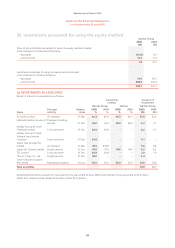
35. Earnings per share
Cents Cents
Basic earnings per share based on net profit attributable to members of Qantas 40.8 35.7
Diluted earnings per share based on net profit attributable to members of Qantas 40.7 35.5
The calculation of earnings per share is based upon the weighted average number of shares outstanding during the year.
Number
M
Number
M
Weighted average number of ordinary shares used in the calculation of basic earnings per share 1,869.2 1,815.4
Weighted average number of ordinary shares used in the calculation of diluted earnings per share11,878.4 1,826.6
1 Includes the effect of 27.6 million (2004: 33.7 million) Entitlements awarded under QLTEIP, which have a dilutive earnings per share impact of 9.2 million
(2004: 11.2 million) ordinary shares.