Qantas 2005 Annual Report Download - page 103
Download and view the complete annual report
Please find page 103 of the 2005 Qantas annual report below. You can navigate through the pages in the report by either clicking on the pages listed below, or by using the keyword search tool below to find specific information within the annual report.-
 1
1 -
2
-
3
-
4
-
5
-
6
-
7
-
8
-
9
-
10
-
11
-
12
-
13
-
14
-
15
-
16
-
17
-
18
-
19
-
20
-
21
-
22
-
23
-
24
-
25
-
26
-
27
-
28
-
29
-
30
-
31
-
32
-
33
-
34
-
35
-
36
-
37
-
38
-
39
-
40
-
41
-
42
-
43
-
44
-
45
-
46
-
47
-
48
-
49
-
50
-
51
-
52
-
53
-
54
-
55
-
56
-
57
-
58
-
59
-
60
-
61
-
62
-
63
-
64
-
65
-
66
-
67
-
68
-
69
-
70
-
71
-
72
-
73
-
74
-
75
-
76
-
77
-
78
-
79
-
80
-
81
-
82
-
83
-
84
-
85
-
86
-
87
-
88
-
89
-
90
-
91
-
92
-
 93
93 -
 94
94 -
 95
95 -
 96
96 -
 97
97 -
 98
98 -
 99
99 -
 100
100 -
 101
101 -
 102
102 -
 103
103 -
 104
104 -
 105
105 -
 106
106 -
 107
107 -
 108
108 -
 109
109 -
 110
110 -
 111
111 -
 112
112 -
 113
113 -
114
-
115
-
116
-
117
-
118
-
119
-
120
-
121
-
122
-
123
-
124
-
125
-
126
-
127
-
128
 |
 |

101
Qantas Annual Report 2005
~Notes to the Financial Statements~
for the year ended 30 June 2005
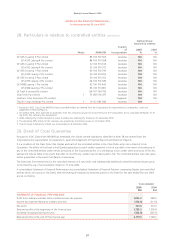
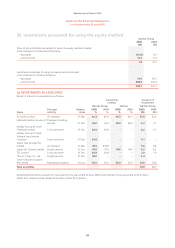
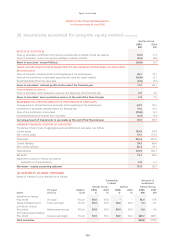
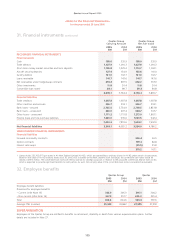
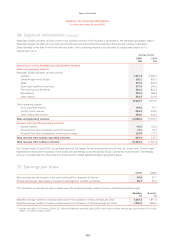
30. Investments accounted for using the equity method continued
Qantas Group
2005
$M
2004
$M
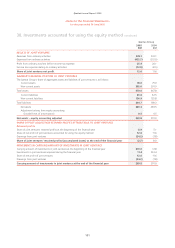
RESULTS OF JOINT VENTURES
Revenues from ordinary activities 478.1 333.1
Expenses from ordinary activities (452.7) (313.0)
Profit from ordinary activities before income tax expense 25.4 20.1
Income tax expense relating to ordinary activities (12.8) (8.5)
Share of joint ventures net profit 12.6 11.6
SUMMARY FINANCIAL POSITION OF JOINT VENTURES
The Qantas Group’s share of aggregate assets and liabilities of joint ventures is as follows:
Current assets 78.0 75.9
Non-current assets 392.0 391.9
Total assets 470.0 467.8
Current liabilities 63.8 62.5
Non-current liabilities 136.9 135.8
Total liabilities 200.7 198.3
Net assets 269.3 269.5
Adjustment arising from equity accounting:
Goodwill (net of amortisation) 0.5 0.5
Net assets – equity accounting adjusted 269.8 270.0
SHARE OF POST-ACQUISITION RETAINED PROFITS ATTRIBUTABLE TO JOINT VENTURES
Retained profits
Share of joint ventures’ retained profits at the beginning of the financial year 8.9 5.1
Share of net profit of joint ventures accounted for using the equity method 12.6 11.6
Drawings from joint ventures (24.2) (7.8)
Share of joint ventures’ retained profits/(accumulated losses) at the end of the financial year (2.7) 8.9
MOVEMENTS IN CARRYING AMOUNT OF INVESTMENTS IN JOINT VENTURES
Carrying amount of investments in joint ventures at the beginning of the financial year 270.0 12.8
Investments in joint ventures acquired during the financial year 11.4 253.4
Share of net profit of joint ventures 12.6 11.6
Drawings from joint ventures (24.2) (7.8)
Carrying amount of investments in joint ventures at the end of the financial year 269.8 270.0