Qantas 2005 Annual Report Download - page 68
Download and view the complete annual report
Please find page 68 of the 2005 Qantas annual report below. You can navigate through the pages in the report by either clicking on the pages listed below, or by using the keyword search tool below to find specific information within the annual report.-
 1
1 -
2
-
3
-
4
-
5
-
6
-
7
-
8
-
9
-
10
-
11
-
12
-
13
-
14
-
15
-
16
-
17
-
18
-
19
-
20
-
21
-
22
-
23
-
24
-
25
-
26
-
27
-
28
-
29
-
30
-
31
-
32
-
33
-
34
-
35
-
36
-
37
-
38
-
39
-
40
-
41
-
42
-
43
-
44
-
45
-
46
-
47
-
48
-
49
-
50
-
51
-
52
-
53
-
54
-
55
-
56
-
57
-
 58
58 -
 59
59 -
 60
60 -
 61
61 -
 62
62 -
 63
63 -
 64
64 -
 65
65 -
 66
66 -
 67
67 -
 68
68 -
 69
69 -
 70
70 -
 71
71 -
 72
72 -
 73
73 -
 74
74 -
 75
75 -
 76
76 -
 77
77 -
 78
78 -
79
-
80
-
81
-
82
-
83
-
84
-
85
-
86
-
87
-
88
-
89
-
90
-
91
-
92
-
93
-
94
-
95
-
96
-
97
-
98
-
99
-
100
-
101
-
102
-
103
-
104
-
105
-
106
-
107
-
108
-
109
-
110
-
111
-
112
-
113
-
114
-
115
-
116
-
117
-
118
-
119
-
120
-
121
-
122
-
123
-
124
-
125
-
126
-
127
-
128
 |
 |
66
Spirit of Australia
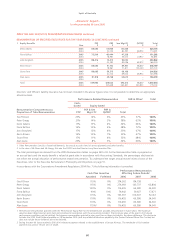
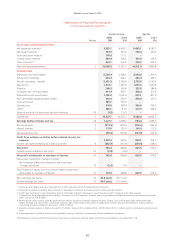
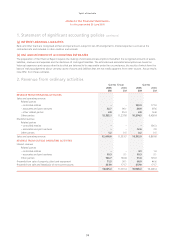
~Statements of Financial Position~
as at 30 June 2005
Qantas Group Qantas
Notes
2005
$M
2004
$M
2005
$M
2004
$M
CURRENT ASSETS
Cash 7 198.0 335.9 339.9 254.7
Receivables 8 2,836.1 2,116.3 2,841.3 2,203.4
Net receivables under hedge/swap contracts 185.1 302.1 184.8 301.8
Inventories 9 333.0 375.5 295.5 348.4
Other 11 157.7 192.2 165.9 210.5
Total current assets 3,709.9 3,322.0 3,827.4 3,318.8
NON-CURRENT ASSETS
Receivables 8 287.7 304.6 969.4 1,977.9
Net receivables under hedge/swap contracts 853.7 997.0 831.6 952.3
Investments accounted for using the equity method 30 343.7 339.7 ––
Other investments 10 99.9 110.1 746.6 777.2
Property, plant and equipment 12 12,612.5 12,256.6 11,242.0 10,673.0
Intangible assets 13 142.0 152.4 45.3 47.2
Deferred tax assets 0.2 0.9 ––
Other 11 84.8 90.9 64.3 64.9
Total non-current assets 14,424.5 14,252.2 13,899.2 14,492.5
Total assets 18,134.4 17,574.2 17,726.6 17,811.3
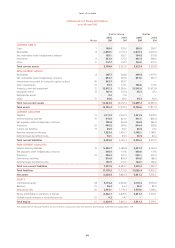
CURRENT LIABILITIES
Payables 14 2,111.2 2,167.5 1,931.5 2,078.9
Interest-bearing liabilities 15 315.0 821.9 315.1 826.4
Net payables under hedge/swap contracts 142.8 250.8 164.8 262.9
Provisions 16 400.2 381.6 344.4 328.8
Current tax liabilities 17 85.9 30.1 83.8 27.2
Revenue received in advance 1,535.8 1,493.3 1,398.1 1,348.1
Deferred lease benefits/income 44.1 45.0 38.5 40.2
Total current liabilities 4,635.0 5,190.2 4,276.2 4,912.5
NON-CURRENT LIABILITIES
Interest-bearing liabilities 15 5,234.7 5,081.8 5,831.4 6,134.3
Net payables under hedge/swap contracts 450.0 131.6 450.0 131.6
Provisions 16 336.3 331.7 303.1 302.3
Deferred tax liabilities 910.6 806.9 910.6 788.3
Deferred lease benefits/income 140.9 191.7 124.1 166.2
Total non-current liabilities 7,072.5 6,543.7 7,619.2 7,522.7
Total liabilities 11,707.5 11,733.9 11,895.4 12,435.2
Net assets 6,426.9 5,840.3 5,831.2 5,376.1
EQUITY
Contributed equity 18 4,173.4 3,994.9 4,173.4 3,994.9
Reserves 19 56.2 54.4 82.9 82.9
Retained profits 20 2,193.1 1,776.3 1,574.9 1,298.3
Equity attributable to members of Qantas 6,422.7 5,825.6 5,831.2 5,376.1
Outside equity interests in controlled entities 22 4.2 14.7 ––
Total equity 21 6,426.9 5,840.3 5,831.2 5,376.1
The Statements of Financial Position are to be read in conjunction with the Notes to the Financial Statements on pages 68 to 118.