Qantas 2005 Annual Report Download - page 42
Download and view the complete annual report
Please find page 42 of the 2005 Qantas annual report below. You can navigate through the pages in the report by either clicking on the pages listed below, or by using the keyword search tool below to find specific information within the annual report.-
 1
1 -
2
-
3
-
4
-
5
-
6
-
7
-
8
-
9
-
10
-
11
-
12
-
13
-
14
-
15
-
16
-
17
-
18
-
19
-
20
-
21
-
22
-
23
-
24
-
25
-
26
-
27
-
28
-
29
-
30
-
31
-
 32
32 -
 33
33 -
 34
34 -
 35
35 -
 36
36 -
 37
37 -
 38
38 -
 39
39 -
 40
40 -
 41
41 -
 42
42 -
 43
43 -
 44
44 -
 45
45 -
 46
46 -
 47
47 -
 48
48 -
 49
49 -
 50
50 -
 51
51 -
 52
52 -
53
-
54
-
55
-
56
-
57
-
58
-
59
-
60
-
61
-
62
-
63
-
64
-
65
-
66
-
67
-
68
-
69
-
70
-
71
-
72
-
73
-
74
-
75
-
76
-
77
-
78
-
79
-
80
-
81
-
82
-
83
-
84
-
85
-
86
-
87
-
88
-
89
-
90
-
91
-
92
-
93
-
94
-
95
-
96
-
97
-
98
-
99
-
100
-
101
-
102
-
103
-
104
-
105
-
106
-
107
-
108
-
109
-
110
-
111
-
112
-
113
-
114
-
115
-
116
-
117
-
118
-
119
-
120
-
121
-
122
-
123
-
124
-
125
-
126
-
127
-
128
 |
 |
40
Spirit of Australia
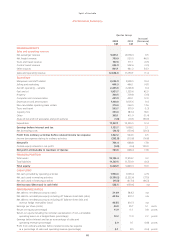
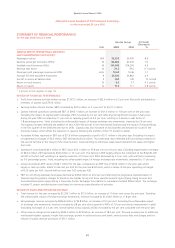
~Performance Summary~
Qantas Group
2005
$M
2004
$M
Increase/
(Decrease)
%
FINANCIAL RESULTS
Sales and operating revenue
Net passenger revenue 9,835.1 8,978.3 9.5
Net freight revenue 759.9 520.5 46.0
Tours and travel revenue 707.8 711.1 (0.5)
Contract work revenue 484.9 502.6 (3.5)
Other sources 861.1 641.2 34.3
Sales and operating revenue 12,648.8 11,353.7 11.4
Expenditure
Manpower and staff related 3,244.9 2,938.5 10.4
Selling and marketing 444.3 466.1 (4.7)
Aircraft operating – variable 2,435.8 2,226.8 9.4
Fuel and oil 1,931.7 1,355.6 42.5
Property 300.5 309.8 (3.0)
Computer and communication 491.9 439.1 12.0
Depreciation and amortisation 1,100.0 1,005.6 9.4
Non-cancellable operating lease rentals 310.0 263.5 17.6
Tours and travel 563.7 570.9 (1.3)
Capacity hire 341.0 287.4 18.6
Other 365.1 411.9 (11.4)
Share of net profit of associates and joint ventures
(1.8)
(19.7) (90.9)
Expenditure 11,527.1 10,255.5 12.4
Earnings before interest and tax 1,121.7 1,098.2 2.1
Net borrowing costs (94.5) (133.6) (29.3)
Profit from ordinary activities before related income tax expense 1,027.2 964.6 6.5
Income tax expense relating to ordinary activities (262.8) (315.8) (16.8)
Net profit 764.4 648.8 17.8
Outside equity interests in net profit (0.8) (0.4) 100.0
Net profit attributable to members of Qantas 763.6 648.4 17.8
FINANCIAL POSITION
Total assets 18,134.4 17,574.2 3.2
Total liabilities 11,707.5 11,733.9 ( 0.2)
Total equity 6,426.9 5,840.3 10.0
CASH FLOWS
Net cash provided by operating activities 1,950.0 1,999.4 (2.5)
Net cash used in investing activities (1,396.2) (2,232.6) (37.5)
Net cash used in financing activities (15.3) (417.4) (96.3)
Net increase/(decrease) in cash held 538.5 (650.6) n/a
PERFORMANCE RATIOS
Net debt to net debt plus equity (ratio) 31:69 38:62 n/a
Net debt to net debt plus equity including off balance sheet debt (ratio) 44:56 49:51 n/a
Net debt to net debt plus equity including off balance sheet debt and
revenue hedge receivables (ratio) 45:55 49:51 n/a
Earnings per share (cents) 40.8 35.7 5.1 cents
Return on equity (percentage) 11.9 11.1 0.8 point s
Return on equity including the notional capitalisation of non-cancellable
operating leases on a hedged basis (percentage) 13.2 11.0 2.2 points
Earnings before interest and tax as a percentage of sales and
operating revenue (percentage) 8.9 9.7 (0.8) points
Profit from ordinary activities before related income tax expense
as a percentage of sales and operating revenue (percentage) 8.1 8.5 (0.4) points