Qantas 2005 Annual Report Download - page 104
Download and view the complete annual report
Please find page 104 of the 2005 Qantas annual report below. You can navigate through the pages in the report by either clicking on the pages listed below, or by using the keyword search tool below to find specific information within the annual report.-
 1
1 -
2
-
3
-
4
-
5
-
6
-
7
-
8
-
9
-
10
-
11
-
12
-
13
-
14
-
15
-
16
-
17
-
18
-
19
-
20
-
21
-
22
-
23
-
24
-
25
-
26
-
27
-
28
-
29
-
30
-
31
-
32
-
33
-
34
-
35
-
36
-
37
-
38
-
39
-
40
-
41
-
42
-
43
-
44
-
45
-
46
-
47
-
48
-
49
-
50
-
51
-
52
-
53
-
54
-
55
-
56
-
57
-
58
-
59
-
60
-
61
-
62
-
63
-
64
-
65
-
66
-
67
-
68
-
69
-
70
-
71
-
72
-
73
-
74
-
75
-
76
-
77
-
78
-
79
-
80
-
81
-
82
-
83
-
84
-
85
-
86
-
87
-
88
-
89
-
90
-
91
-
92
-
93
-
 94
94 -
 95
95 -
 96
96 -
 97
97 -
 98
98 -
 99
99 -
 100
100 -
 101
101 -
 102
102 -
 103
103 -
 104
104 -
 105
105 -
 106
106 -
 107
107 -
 108
108 -
 109
109 -
 110
110 -
 111
111 -
 112
112 -
 113
113 -
 114
114 -
115
-
116
-
117
-
118
-
119
-
120
-
121
-
122
-
123
-
124
-
125
-
126
-
127
-
128
 |
 |

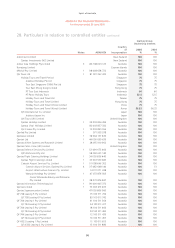
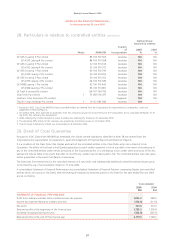
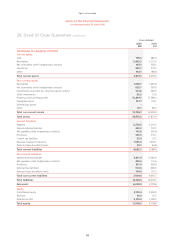
102
Spirit of Australia
~Notes to the Financial Statements~
for the year ended 30 June 2005
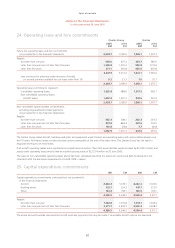
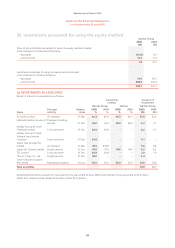
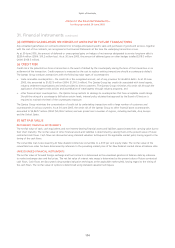
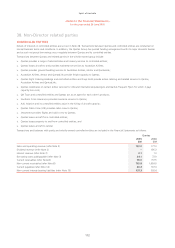
31. Financial instruments
A financial instrument is any contract that gives rise to both a financial asset of one entity and a financial liability or equity instrument of
another entity. The Qantas Group is subject to interest rate, foreign currency, fuel price and credit risks. The Qantas Group manages these
risk exposures using various financial instruments, using a set of policies approved by the Board of Directors. Qantas Group policy is not to
enter, issue or hold derivative financial instruments for speculative trading purposes.
(a) INTEREST RATE RISK
The Qantas Group manages interest rate risk by reference to a duration target, being a measure of the sensitivity of the borrowing
portfolio to changes in interest rates. The relative mix of fixed and floating interest rate funding is managed by using interest rate swaps,
forward rate agreements and options. Interest payments and receipts under interest rate swaps are recognised on an accruals basis in
the Statements of Financial Performance. Premiums paid on interest rate options are amortised over the period of the hedge. The Qantas
Group’s exposure to interest rate risk and the effective weighted average interest rate for classes of financial assets and liabilities are set
out below:
2005 Notes
Weighted
Average
Interest
Rate
(%)
Floating
Rate
$M
Fixed Rate Maturing in:
Non-
Interest-
Bearing
$M
Total
$M
Less
than
1 Year
$M
1 to 5
Years
$M
More
than
5 Years
$M
RECOGNISED FINANCIAL ASSETS
Cash 7 5.50198.0––––198.0
Trade debtors 8 –––––1,027.91,027.9
Short-term money market securities and
term deposits 8 5.68–1,705.8–––1,705.8
Aircraft security deposits 8 5.56 46.5 0.4 77.4 – 3.1 127.4
Sundry debtors 8 –––––121.0121.0
Loans receivable 8 7.96––13.5128.2–141.7
Net receivables under hedge/swap
contracts1–172.2 11.0240.4250.8 –674.4
Other investments 10 –––––11.811.8
Convertible loan notes 10 –––––88.188.1
416.7 1,717.2 331.3 379.0 1,251.9 4,096.1
RECOGNISED FINANCIAL LIABILITIES
Trade creditors 14 –––––1,687.81,687.8
Other creditors and accruals 14 –––––206.7206.7
Bank loans – secured 15 3.28 1,711.8 81.7 384.0 548.0 – 2,725.5
Bank loans – unsecured 15 6.06630.0––––630.0
Other loans – unsecured 15 7.38717.2–454.0––1,171.2
Finance lease and hire purchase liabilities 15 7.18 445.9 22.7 369.1 185.3 – 1,023.0
3,504.9 104.4 1,207.1 733.3 1,894.5 7,444.2
Net financial assets/(liabilities) (3,088.2) 1,612.8 (875.8) (354.3) (642.6) (3,348.1)
UNRECOGNISED FINANCIAL
LIABILITIES
Interest rate swaps21,054.6 (1,097.8) (32.0) 75.2 – –
1 Notional principal amounts. Interest receivable/payable has been included in the calculation of the effective interest rate of the underlying financial asset
or liability. Excludes unrealised amounts on revenue back-to-back hedges. As at 30 June 2005, the amount of deferred or unrecognised gains on hedges
of net revenue designated to service long-term debt is $228.4 million.
2 Notional principal amounts.