Qantas 2005 Annual Report Download - page 69
Download and view the complete annual report
Please find page 69 of the 2005 Qantas annual report below. You can navigate through the pages in the report by either clicking on the pages listed below, or by using the keyword search tool below to find specific information within the annual report.-
 1
1 -
2
-
3
-
4
-
5
-
6
-
7
-
8
-
9
-
10
-
11
-
12
-
13
-
14
-
15
-
16
-
17
-
18
-
19
-
20
-
21
-
22
-
23
-
24
-
25
-
26
-
27
-
28
-
29
-
30
-
31
-
32
-
33
-
34
-
35
-
36
-
37
-
38
-
39
-
40
-
41
-
42
-
43
-
44
-
45
-
46
-
47
-
48
-
49
-
50
-
51
-
52
-
53
-
54
-
55
-
56
-
57
-
58
-
 59
59 -
 60
60 -
 61
61 -
 62
62 -
 63
63 -
 64
64 -
 65
65 -
 66
66 -
 67
67 -
 68
68 -
 69
69 -
 70
70 -
 71
71 -
 72
72 -
 73
73 -
 74
74 -
 75
75 -
 76
76 -
 77
77 -
 78
78 -
 79
79 -
80
-
81
-
82
-
83
-
84
-
85
-
86
-
87
-
88
-
89
-
90
-
91
-
92
-
93
-
94
-
95
-
96
-
97
-
98
-
99
-
100
-
101
-
102
-
103
-
104
-
105
-
106
-
107
-
108
-
109
-
110
-
111
-
112
-
113
-
114
-
115
-
116
-
117
-
118
-
119
-
120
-
121
-
122
-
123
-
124
-
125
-
126
-
127
-
128
 |
 |
67
Qantas Annual Report 2005
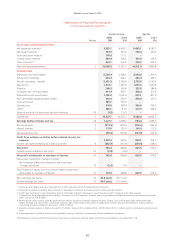
~Statements of Cash Flows~
for the year ended 30 June 2005
Qantas Group Qantas
Notes
2005
$M
2004
$M
2005
$M
2004
$M
CASH FLOWS FROM OPERATING ACTIVITIES
Cash receipts in the course of operations 13,211.0 12,328.5 11,050.7 10,111. 3
Cash payments in the course of operations (11,015.9) (10,128.6) (9,186.3) (8,396.0)
Interest received 116.9 126.0 101.2 112.3
Borrowing costs paid (287.2) (305.6) (206.6) (312.1)
Dividends received 28.1 12.4 12.8 222.6
Income taxes paid (102.9) (33.3) (60.8) 134.8
Net cash provided by operating activities 37 1,950.0 1,999.4 1,711.0 1,872.9
CASH FLOWS FROM INVESTING ACTIVITIES
Payments for property, plant and equipment (1,682.9) (2,007.0) (1,214.8) (1,210.8)
Proceeds from sale of property, plant and equipment 71.5 50.1 66.9 46.6
Proceeds from sale and leaseback of non-current assets1257.9 171.7 257.9 171.7
Payments for investments, net of cash acquired (44.6) (271.9) (29.4) (271.7)
Repayments/(advances) of investment loans 1.9 (128.2) –(128.2)
Payments for other intangibles –(47.3) –(47.3)
Net cash used in investing activities (1,396.2) (2,232.6) (919.4) (1,439.7)
CASH FLOWS FROM FINANCING ACTIVITIES
Repayments of borrowings (1,144.5) (1,822.9) (1,180.4) (2,834.9)
Proceeds from borrowings/swaps 1,302.9 1,413.2 1,322.2 1,701.4
Net proceeds from the issue of shares –90.6 –90.6
Receipts for aircraft security deposits 1.3 63.1 0.9 59.3
Dividends paid (175.0) (161.4) (172.7) (159.1)
Net cash used in financing activities (15.3) (417.4) (30.0) (1,142.7)
RECONCILIATION OF CASH PROVIDED BY/(USED IN)
Operating activities 1,950.0 1,999.4 1,711.0 1,872.9
Investing activities (1,396.2) (2,232.6) (919.4) (1,439.7)
Financing activities (15.3) (417.4) (30.0) (1,142.7)
Net increase/(decrease) in cash held 538.5 (650.6) 761.6 (709.5)
Cash at the beginning of the financial year 1,365.3 2,015.9 1,284.1 1,993.6
Cash at the end of the financial year 37 1,903.8 1,365.3 2,045.7 1,284.1
1 Included in the proceeds from sale and leaseback of non-current assets was $18.8 million in relation to an A320 aircraft. The rights to this aircraft were
sold prior to delivery of the aircraft to a lessor and leased back via operating lease.
The Statements of Cash Flows are to be read in conjunction with the Notes to the Financial Statements on pages 68 to 118.