Qantas 2005 Annual Report Download - page 109
Download and view the complete annual report
Please find page 109 of the 2005 Qantas annual report below. You can navigate through the pages in the report by either clicking on the pages listed below, or by using the keyword search tool below to find specific information within the annual report.-
 1
1 -
2
-
3
-
4
-
5
-
6
-
7
-
8
-
9
-
10
-
11
-
12
-
13
-
14
-
15
-
16
-
17
-
18
-
19
-
20
-
21
-
22
-
23
-
24
-
25
-
26
-
27
-
28
-
29
-
30
-
31
-
32
-
33
-
34
-
35
-
36
-
37
-
38
-
39
-
40
-
41
-
42
-
43
-
44
-
45
-
46
-
47
-
48
-
49
-
50
-
51
-
52
-
53
-
54
-
55
-
56
-
57
-
58
-
59
-
60
-
61
-
62
-
63
-
64
-
65
-
66
-
67
-
68
-
69
-
70
-
71
-
72
-
73
-
74
-
75
-
76
-
77
-
78
-
79
-
80
-
81
-
82
-
83
-
84
-
85
-
86
-
87
-
88
-
89
-
90
-
91
-
92
-
93
-
94
-
95
-
96
-
97
-
98
-
 99
99 -
 100
100 -
 101
101 -
 102
102 -
 103
103 -
 104
104 -
 105
105 -
 106
106 -
 107
107 -
 108
108 -
 109
109 -
 110
110 -
 111
111 -
 112
112 -
 113
113 -
 114
114 -
 115
115 -
 116
116 -
 117
117 -
 118
118 -
 119
119 -
120
-
121
-
122
-
123
-
124
-
125
-
126
-
127
-
128
 |
 |
107
Qantas Annual Report 2005
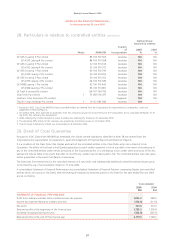
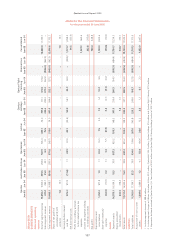
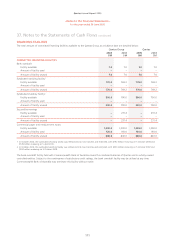
~Notes to the Financial Statements~
for the year ended 30 June 2005
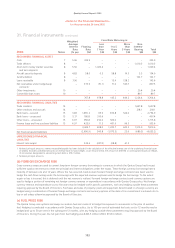
Qantas Australian Airlines QantasLink Jetstar
Qantas
Holidays
Qantas Flight
Catering Eliminations Consolidated
Jun 05 Jun 04 Jun 05 Jun 04 Jun 05 Jun 04 Jun 05 Jun 04 Jun 05 Jun 04 Jun 05 Jun 04 Jun 05 Jun 04 Jun 05 Jun 04
ANALYSIS BY
BUSINESS SEGMENTS
Sales and operating
revenue
External segment revenue
10,458.7 9,603.0 305.5 265.8 561.9 565.4 440.1 34.0 707.8 711.1 174.8 174.4 ––12,648.8 11, 353.7
Inter-segment revenue
227.4 295.7 25.3 20.1 8.9 0.1 75.5 –233.6 283.3 377.3 362.8 (948.0) (962.0) ––
Total segment revenue
10,686.1 9,898.7 330.8 285.9 570.8 565.5 515.6 34.0 941.4 994.4 552.1 537.2 (948.0) (962.0) 12,648.8 11, 353.7
Share of net profit of
associates and joint
ventures
1.8 19.7 – – – – – – – – – – ––1.8 19.7
Earnings before interest
and tax
973.31977.4 (11.6)21.1 42.9297.0 44.1 (23.4) 50.9254.1 22.1290.0 – (98.0)31,121.7 1,098.2
Net borrowing costs
94.5 (133.6)
Profit from ordinary activities
before related income tax
expense
1,027.2 964.6
Income tax expense relating
to ordinary activities
262.8 (315.8)
Net profit
764.4 648.8
Depreciation and
amortisation
1,057.3 971.8 1.0 1.1 22.0 15.5 7.5 5.9 1.9 1.4 10.3 9.9 1,100.0 1,005.6
Non-cash (revenue)/
expense
(62.0) (19.1) 4.2 1.1 3.4 5.5 (0.3) –0.2 (0.1) (0.1) (0.2) (54.6) (12.8)
Assets
Segment assets
16,875.1 16,594.2 15.3 30.8 687.2 425.2 199.3 148.3 341.8 326.4 280.5 194.0 (608.5) (484.4) 17,790.7 17,234.5
Equity accounted
investments
342.3 338.4 – – – – – – 1.4 1.3 – – – – 343.7 339.7
Total assets
17,217.4 16,932.6 15.3 30.8 687.2 425.2 199.3 148.3 343.2 327.7 280.5 194.0 (608.5) (484.4) 18,134.4 17,574.2
Liabilities
Total liabilities
11,163.0 11, 36 4.7 32.5 39.8 434.6 199.6 267.0 240.8 223.2 249.6 195.7 123.8 (608.5) (484.4) 11,707.5 11,733.9
Acquisition of non-current
assets
1,581.6 1,886.6 1.2 0.1 55.4 104.6 36.0 12.2 2.6 1.2 6.1 2.3 – – 1,682.9 2,007.0
1 Includes segment revenue of $98.6 million.
2 Includes segment charges as follows: Australian Airlines $9.3 million; QantasLink $44.3 million; Qantas Holidays $7.6 million and Qantas Flight Catering $37.4 million.
3 Represents dividends received by Qantas from Q.H. Tours Limited of $58.3 million and Qantas Flight Catering Holdings Limited of $39.7 million.