Proctor and Gamble 2014 Annual Report Download - page 78
Download and view the complete annual report
Please find page 78 of the 2014 Proctor and Gamble annual report below. You can navigate through the pages in the report by either clicking on the pages listed below, or by using the keyword search tool below to find specific information within the annual report.-
 1
1 -
2
-
3
-
4
-
5
-
6
-
7
-
8
-
9
-
10
-
11
-
12
-
13
-
14
-
15
-
16
-
17
-
18
-
19
-
20
-
21
-
22
-
23
-
24
-
25
-
26
-
27
-
28
-
29
-
30
-
31
-
32
-
33
-
34
-
35
-
36
-
37
-
38
-
39
-
40
-
41
-
42
-
43
-
44
-
45
-
46
-
47
-
48
-
49
-
50
-
51
-
52
-
53
-
54
-
55
-
56
-
57
-
58
-
59
-
60
-
61
-
62
-
63
-
64
-
65
-
66
-
67
-
 68
68 -
 69
69 -
 70
70 -
 71
71 -
 72
72 -
 73
73 -
 74
74 -
 75
75 -
 76
76 -
 77
77 -
 78
78 -
 79
79 -
 80
80 -
 81
81 -
 82
82 -
 83
83 -
 84
84 -
 85
85 -
 86
86 -
 87
87 -
 88
88 -
89
-
90
-
91
-
92
-
93
-
94
 |
 |

76 The Procter & Gamble Company
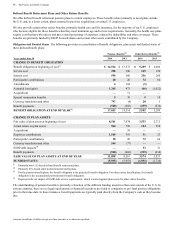
Amounts in millions of dollars except per share amounts or as otherwise specified.
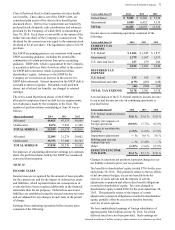
business are presented as discontinued operations and, as
such, have been excluded from both continuing operations
and segment results for all years presented.
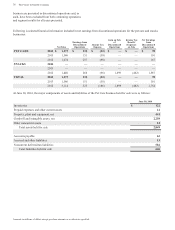
Following is selected financial information included in net earnings from discontinued operations for the pet care and snacks
businesses:
Net Sales
Earnings from
Discontinued
Operations
Income Tax
Expense
Gain on Sale
of
Discontinued
Operations
Income Tax
Benefit/
(Expense)
on Sale
Net Earnings
from
Discontinued
Operations
PET CARE 2014 $ 1,475 $ 130 $ (52)$—$—$78
2013 1,586 151 (50) — — 101
2012 1,674 257 (90) — — 167
SNACKS 2014 — — — — — —
2013 — — — — — —
2012 1,440 266 (96) 1,899 (482) 1,587
TOTAL 2014 1,475 130 (52) — — 78
2013 1,586 151 (50) — — 101
2012 3,114 523 (186) 1,899 (482) 1,754
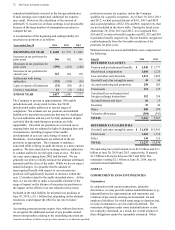
At June 30, 2014, the major components of assets and liabilities of the Pet Care business held for sale were as follows:
June 30, 2014
Inventories $ 122
Prepaid expenses and other current assets 14
Property, plant and equipment, net 441
Goodwill and intangible assets, net 2,258
Other noncurrent assets 14
Total assets held for sale 2,849
Accounts payable 63
Accrued and other liabilities 13
Noncurrent deferred tax liabilities 584
Total liabilities held for sale 660