Proctor and Gamble 2014 Annual Report Download - page 35
Download and view the complete annual report
Please find page 35 of the 2014 Proctor and Gamble annual report below. You can navigate through the pages in the report by either clicking on the pages listed below, or by using the keyword search tool below to find specific information within the annual report.-
 1
1 -
2
-
3
-
4
-
5
-
6
-
7
-
8
-
9
-
10
-
11
-
12
-
13
-
14
-
15
-
16
-
17
-
18
-
19
-
20
-
21
-
22
-
23
-
24
-
 25
25 -
 26
26 -
 27
27 -
 28
28 -
 29
29 -
 30
30 -
 31
31 -
 32
32 -
 33
33 -
 34
34 -
 35
35 -
 36
36 -
 37
37 -
 38
38 -
 39
39 -
 40
40 -
 41
41 -
 42
42 -
 43
43 -
 44
44 -
 45
45 -
46
-
47
-
48
-
49
-
50
-
51
-
52
-
53
-
54
-
55
-
56
-
57
-
58
-
59
-
60
-
61
-
62
-
63
-
64
-
65
-
66
-
67
-
68
-
69
-
70
-
71
-
72
-
73
-
74
-
75
-
76
-
77
-
78
-
79
-
80
-
81
-
82
-
83
-
84
-
85
-
86
-
87
-
88
-
89
-
90
-
91
-
92
-
93
-
94
 |
 |

The Procter & Gamble Company 33
net sales growth. Disproportionate growth in developing
regions drove unfavorable geographic mix reducing net sales
by 1%. Unfavorable foreign exchange reduced net sales by
1%. Global market share of the Health Care segment
increased 0.2 points. Volume increased low single digits in
both developed and developing regions. Oral Care volume
increased low single digits due to a mid-single digit increase
in developing regions behind geographic market expansion
and market growth and a low single-digit increase in
developed regions from innovation. Global market share of
the oral care category increased less than half a point.
Volume in Personal Health Care decreased low single digits
due to a weak cough and cold season which was only
partially offset by innovation and market expansion.
Net earnings decreased 1% to $1.1 billion as increased net
sales was more than offset by a 30-basis point decrease in
net earnings margin. Net earnings margin decreased due to
gross margin contraction partially offset by lower overheads.
Gross margin decreased due to the impact of foreign
exchange and negative geographic and product mix, partially
offset by manufacturing cost savings and pricing.
Fiscal year 2013 compared with fiscal year 2012
Health Care net sales increased 6% to $7.7 billion in 2013
on a 5% increase in unit volume. Organic sales were up 7%.
Unfavorable foreign exchange reduced net sales by 3%.
Price increases across all regions contributed 1% to net sales
growth. Favorable geographic and product mix increased net
sales by 2%. The mix impact from acquisitions and
divestitures increased net sales by 1%. Global market share
of the Health Care segment decreased 0.2 points. Volume
increased high single digits in developing regions and
increased low single digits in developed regions. Oral Care
volume increased mid-single digits due to geographic
expansion, innovation and market growth. Global market
share of the oral care category was down slightly. Volume in
Personal Health Care increased mid-single digits partially
due to a net increase from prior year acquisition and
divestiture activity (the addition of the PGT Healthcare
partnership and New Chapter VMS, partially offset by the
divestiture of the PuR business). Organic volume increased
low single digits primarily due to the launch of ZzzQuil and
geographic expansion for Vicks.
Net earnings increased 7% to $1.1 billion due to higher net
sales and a 10-basis point increase in net earnings margin.
Net earnings margin increased due to a reduction in
overhead spending partially offset by gross margin
contraction. Gross margin decreased due to increased
commodity costs and supply chain investments, partially
offset by higher pricing and manufacturing cost savings.
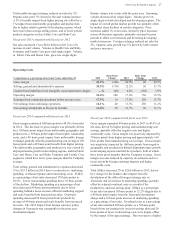
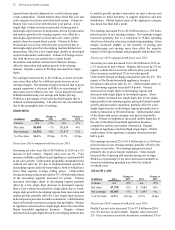
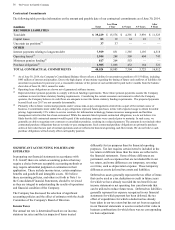
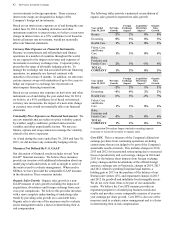
FABRIC CARE AND HOME CARE
($ millions) 2014
Change vs
2013 2013
Change vs
2012
Volume n/a +5% n/a +3%
Net sales $26,060 +1% $ 25,862 +1%
Net earnings $3,039 -2% $ 3,089 +10%
% of Net Sales 11.7% (20) bps 11.9% 90 bps
Fiscal year 2014 compared with fiscal year 2013
Fabric Care and Home Care net sales increased 1% to $26.1
billion in 2014 on a 5% increase in unit volume. Organic sales
were up 4%. Unfavorable foreign exchange reduced net sales
by 3%. Unfavorable geographic and product mix decreased
net sales by 1%. Global market share of the Fabric Care and
Home Care segment increased 0.2 points. Volume increased
high single digits in developing regions and low single digits
in developed regions. Fabric Care volume increased mid-
single digits driven by a high single digit volume increase in
developing regions behind market growth and innovation, and
a low single digit increase in developed regions due to product
innovation. Global market share of the fabric care category
was flat. Home Care volume increased mid-single digits driven
by a high single digit increase in developing markets from
distribution expansion and market growth, and from a low
single digit increase in developed regions due to product
innovation. Global market share of the home care category
was up less than half a point. Batteries volume increased mid-
single digits due to new customer distribution in developed
regions and market growth in developing regions. Global
market share of the batteries category was up more than a point.
Net earnings decreased 2% to $3.0 billion as net sales growth
was more than offset by a 20-basis point decrease in net
earnings margin. Net earnings margin decreased due to gross
margin contraction partially offset by a decrease in SG&A as
a percentage of sales. Gross margin decreased due to
unfavorable geographic and product mix and the impact of
foreign exchange, which was partially offset by manufacturing
cost savings. SG&A as a percentage of net sales decreased due
to marketing and overhead efficiencies.
Fiscal year 2013 compared with fiscal year 2012
Fabric Care and Home Care net sales increased 1% in 2013
to $25.9 billion on a 3% increase in unit volume. Organic
sales were up 4%. Price increases contributed 1% to net
sales growth. Unfavorable foreign exchange reduced net
sales by 3%. Global market share of the Fabric Care and
Home Care segment decreased 0.3 points. Volume increased
mid-single digits in developing regions and low single digits
in developed regions. Fabric Care volume increased low
single digits behind low single-digit growth in developed
regions and mid-single-digit growth in developing regions,
driven primarily by Asia. Overall growth due to innovation
and market growth was partially offset by the impacts of
competitive activity. Global market share of the fabric care
category decreased more than half a point. Home Care
volume increased mid-single digits driven by a high single-