Proctor and Gamble 2014 Annual Report Download - page 34
Download and view the complete annual report
Please find page 34 of the 2014 Proctor and Gamble annual report below. You can navigate through the pages in the report by either clicking on the pages listed below, or by using the keyword search tool below to find specific information within the annual report.-
 1
1 -
2
-
3
-
4
-
5
-
6
-
7
-
8
-
9
-
10
-
11
-
12
-
13
-
14
-
15
-
16
-
17
-
18
-
19
-
20
-
21
-
22
-
23
-
 24
24 -
 25
25 -
 26
26 -
 27
27 -
 28
28 -
 29
29 -
 30
30 -
 31
31 -
 32
32 -
 33
33 -
 34
34 -
 35
35 -
 36
36 -
 37
37 -
 38
38 -
 39
39 -
 40
40 -
 41
41 -
 42
42 -
 43
43 -
 44
44 -
45
-
46
-
47
-
48
-
49
-
50
-
51
-
52
-
53
-
54
-
55
-
56
-
57
-
58
-
59
-
60
-
61
-
62
-
63
-
64
-
65
-
66
-
67
-
68
-
69
-
70
-
71
-
72
-
73
-
74
-
75
-
76
-
77
-
78
-
79
-
80
-
81
-
82
-
83
-
84
-
85
-
86
-
87
-
88
-
89
-
90
-
91
-
92
-
93
-
94
 |
 |

32 The Procter & Gamble Company
regions from reduced shipments as a result of price gaps
versus competition. Global market share of the hair care and
color category was down more than half a point. Volume in
Beauty Care was in line with the prior year period. A low
single-digit volume increase in personal cleansing and a
mid-single-digit increase in deodorants, driven by innovation
and market growth in developing regions, was offset by a
mid-single-digit decline in facial skin care, where global
market share decreased about a point. Volume in Salon
Professional was in line with the prior year period due to
mid-single-digit growth in developing markets behind new
innovations, offset by a low single-digit decline in developed
regions from market contraction. Volume in Prestige was in
line with the prior year period due to minor brand
divestitures and market contraction in Western Europe,
offset by innovation and market growth in developing
markets. Organic volume in Prestige increased low single
digits.
Net earnings increased 4% to $2.5 billion, as lower net sales
were more than offset by a 60-basis point increase in net
earnings margin. Net earnings margin increased due to gross
margin expansion, a decrease in SG&A as a percentage of
sales and a lower effective tax rate. Gross margin increased
behind manufacturing cost savings and higher pricing.
SG&A as a percentage of net sales declined largely due to
reduced overhead spending. The effective tax rate declined
due to the geographic mix of earnings.
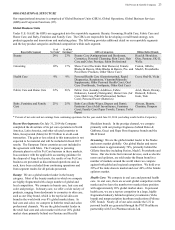
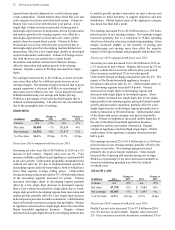
GROOMING
($ millions) 2014
Change vs
2013 2013
Change vs
2012
Volume n/a +1% n/a -1%
Net sales $8,009 —% $8,038 -4%
Net earnings $1,954 +6% $1,837 +2%
% of Net Sales 24.4% 150 bps 22.9% 120 bps
Fiscal year 2014 compared with fiscal year 2013
Grooming net sales were flat at $8.0 billion in 2014 on a 1%
increase in unit volume. Organic sales were up 3%. Price
increases in Blades and Razors andAppliances contributed 4%
to net sales growth. Unfavorable geographic and product mix
reduced net sales by 2% due to disproportionate growth in
developing regions and mid-tier products, both of which have
lower than segment average selling prices. Unfavorable
foreign exchange reduced net sales by 3%. Global market share
of the Grooming segment increased 0.2 points. Volume
increased mid-single digits in developing regions partially
offset by a low single digit decrease in developed regions.
Shave Care volume increased low single digits due to a mid-
single-digit growth in developing regions from innovation and
market growth, partially offset by a low single-digit decrease
in developed regions due to market contraction. Global market
share of the blades and razors category was up slightly. Volume
in Appliances decreased low single digits due to the sale of the
Braun household appliances business. Organic volume
increased mid-single digits driven by developing markets due
to market growth, product innovation on men's shavers and
shipments to build inventory to support initiatives and new
distributors. Global market share of the appliances category
was down less than half a point.
Net earnings increased 6% to $2.0 billion due to a 150 basis-
point increase in net earnings margin. Net earnings margin
increased primarily due to a reduction in SG&A spending
which was driven by a decrease in marketing spending. Gross
margin increased slightly as the benefits of pricing and
manufacturing cost savings more than offset the negative
impacts of foreign exchange and geographic and product mix.
Fiscal year 2013 compared with fiscal year 2012
Grooming net sales decreased 4% to $8.0 billion in 2013 on
a 1% decrease in unit volume. Organic sales were up 2% on
organic volume that was in line with the prior year period.
Price increases contributed 2% to net sales growth.
Unfavorable foreign exchange reduced net sales by 4%. The
impact of the Braun household appliances business
divestiture reduced net sales by 1%. Global market share of
the Grooming segment increased 0.4 points. Volume
increased low single digits in developing regions and
decreased mid-single digits in developed regions. Shave
Care volume increased low single digits due to low single-
digit growth in developing regions, primarily behind market
growth and innovation expansion, partially offset by a low
single-digit decrease in developed regions primarily due to
market contraction in Western Europe. Global market share
of the blades and razors category was up less than half a
point. Volume in Appliances decreased double digits due to
the sale of the Braun household appliances business,
competitive activity and market contraction. Organic
volume in Appliances declined high single digits. Global
market share of the appliances category decreased nearly
half a point.
Net earnings increased 2% to $1.8 billion due to a 120-basis
point increase in net earnings margin, partially offset by the
decrease in net sales. Net earnings margin increased
primarily due to gross margin expansion. Gross margin
increased due to pricing and manufacturing cost savings.
SG&A as a percentage of net sales decreased nominally as
increased marketing spending was offset by reduced
overhead costs.
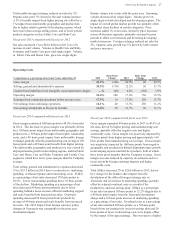
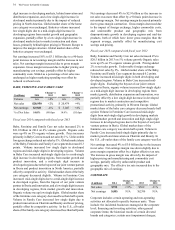
HEALTH CARE
($ millions) 2014
Change vs
2013 2013
Change vs
2012
Volume n/a +2% n/a +5%
Net sales $7,798 +1% $ 7,684 +6%
Net earnings $1,083 -1% $ 1,093 +7%
% of Net Sales 13.9% (30) bps 14.2% 10 bps
Fiscal year 2014 compared with fiscal year 2013
Health Care net sales increased 1% to $7.8 billion in 2014
on a 2% increase in unit volume. Organic sales increased
2%. Price increases across the businesses contributed 1% to