Proctor and Gamble 2014 Annual Report Download - page 27
Download and view the complete annual report
Please find page 27 of the 2014 Proctor and Gamble annual report below. You can navigate through the pages in the report by either clicking on the pages listed below, or by using the keyword search tool below to find specific information within the annual report.-
 1
1 -
2
-
3
-
4
-
5
-
6
-
7
-
8
-
9
-
10
-
11
-
12
-
13
-
14
-
15
-
16
-
 17
17 -
 18
18 -
 19
19 -
 20
20 -
 21
21 -
 22
22 -
 23
23 -
 24
24 -
 25
25 -
 26
26 -
 27
27 -
 28
28 -
 29
29 -
 30
30 -
 31
31 -
 32
32 -
 33
33 -
 34
34 -
 35
35 -
 36
36 -
 37
37 -
38
-
39
-
40
-
41
-
42
-
43
-
44
-
45
-
46
-
47
-
48
-
49
-
50
-
51
-
52
-
53
-
54
-
55
-
56
-
57
-
58
-
59
-
60
-
61
-
62
-
63
-
64
-
65
-
66
-
67
-
68
-
69
-
70
-
71
-
72
-
73
-
74
-
75
-
76
-
77
-
78
-
79
-
80
-
81
-
82
-
83
-
84
-
85
-
86
-
87
-
88
-
89
-
90
-
91
-
92
-
93
-
94
 |
 |

The Procter & Gamble Company 25
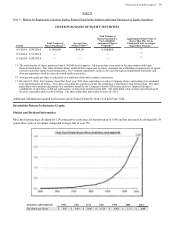
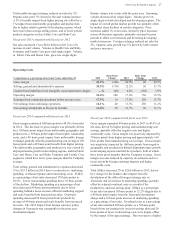
SUMMARY OF 2014 RESULTS
Amounts in millions, except per share amounts 2014
Change vs.
Prior Year 2013
Change vs.
Prior Year 2012
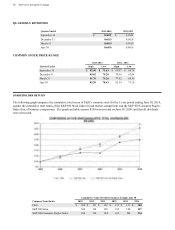
Net sales $ 83,062 1% $ 82,581 1% $ 82,006
Operating income 15,288 7% 14,330 10% 13,035
Net earnings from continuing operations 11,707 4% 11,301 24% 9,150
Net earnings from discontinued operations 78 (23)% 101 (94)% 1,754
Net earnings attributable to Procter & Gamble 11,643 3% 11,312 5% 10,756
Diluted net earnings per common share 4.01 4% 3.86 5% 3.66
Diluted net earnings per share from continuing operations 3.98 4% 3.83 25% 3.06
Core earnings per common share 4.22 5% 4.02 6% 3.79
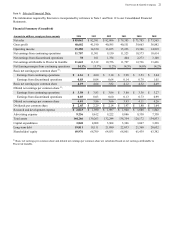
• Net sales increased 1% to $83.1 billion including a
negative 2% impact from foreign exchange.
Organic sales increased 3%.
Unit volume increased 3%. Volume grew mid-
single digits for Fabric Care and Home Care and
Baby, Feminine and Family Care. Volume
increased low single digits for Grooming and
Health Care. Volume was unchanged for Beauty.
• Net earnings attributable to Procter & Gamble were
$11.6 billion, an increase of $331 million or 3% versus
the prior year period.
Net earnings from continuing operations increased
$406 million or 4% largely due to net sales growth
and net earnings margin expansion behind reduced
selling, general and administrative costs (SG&A),
partially offset by gross margin contraction.
Foreign exchange impacts negatively impacted net
earnings by approximately 9%.
Net earnings from discontinued operations
decreased $23 million due to reduced earnings in
Pet Care from ongoing impacts of prior year
product recalls.
• Diluted net earnings per share increased 4% to $4.01.
Diluted net earnings per share from continuing
operations increased 4% to $3.98
Core EPS increased 5% to $4.22.
• Cash flow from operating activities was $14.0 billion.
Free cash flow was $10.1 billion.
Free cash flow productivity was 86%.
ECONOMIC CONDITIONS, CHALLENGES AND
RISKS
We discuss expectations regarding future performance,
events and outcomes, such as our business outlook and
objectives, in annual and quarterly reports, press releases
and other written and oral communications. All such
statements, except for historical and present factual
information, are "forward-looking statements" and are based
on financial data and our business plans available only as of
the time the statements are made, which may become out-of-
date or incomplete. We assume no obligation to update any
forward-looking statements as a result of new information,
future events or other factors. Forward-looking statements
are inherently uncertain and investors must recognize that
events could be significantly different from our expectations.
For more information on risks that could impact our results,
refer to Item 1A Risk Factors in this 10-K.
Ability to Achieve Business Plans. We are a consumer
products company and rely on continued demand for our
brands and products. To achieve business goals, we must
develop and sell products that appeal to consumers and retail
trade customers. Our continued success is dependent on
innovation with respect to both products and operations and
on the continued positive reputations of our brands. This
means we must be able to obtain and maintain patents and
trademarks and respond to technological advances and
patents granted to competition. Our success is also
dependent on effective sales, advertising and marketing
programs in a more fast-paced and rapidly changing
environment. Our ability to innovate and execute in these
areas will determine the extent to which we are able to grow
existing net sales and volume profitably, especially with
respect to the product categories and geographic markets
(including developing markets) in which we have chosen to
focus. There are high levels of competitive activity in the
markets in which we operate. To address these challenges,
we must respond to competitive factors, including pricing,
promotional incentives, trade terms and product initiatives.
We must manage each of these factors, as well as maintain
mutually beneficial relationships with our key customers, in
order to effectively compete and achieve our business plans.
As a company that manages a portfolio of consumer brands,
our ongoing business model involves a certain level of
ongoing acquisition, divestiture and joint venture activities.
We must be able to successfully manage the impacts of these
activities, while at the same time delivering against base
business objectives.
Daily conduct of our business also depends on our ability to
maintain key information technology systems, including
systems operated by third-party suppliers and to maintain
security over our data.