Proctor and Gamble 2014 Annual Report Download - page 70
Download and view the complete annual report
Please find page 70 of the 2014 Proctor and Gamble annual report below. You can navigate through the pages in the report by either clicking on the pages listed below, or by using the keyword search tool below to find specific information within the annual report.-
 1
1 -
2
-
3
-
4
-
5
-
6
-
7
-
8
-
9
-
10
-
11
-
12
-
13
-
14
-
15
-
16
-
17
-
18
-
19
-
20
-
21
-
22
-
23
-
24
-
25
-
26
-
27
-
28
-
29
-
30
-
31
-
32
-
33
-
34
-
35
-
36
-
37
-
38
-
39
-
40
-
41
-
42
-
43
-
44
-
45
-
46
-
47
-
48
-
49
-
50
-
51
-
52
-
53
-
54
-
55
-
56
-
57
-
58
-
59
-
 60
60 -
 61
61 -
 62
62 -
 63
63 -
 64
64 -
 65
65 -
 66
66 -
 67
67 -
 68
68 -
 69
69 -
 70
70 -
 71
71 -
 72
72 -
 73
73 -
 74
74 -
 75
75 -
 76
76 -
 77
77 -
 78
78 -
 79
79 -
 80
80 -
81
-
82
-
83
-
84
-
85
-
86
-
87
-
88
-
89
-
90
-
91
-
92
-
93
-
94
 |
 |

68 The Procter & Gamble Company
Amounts in millions of dollars except per share amounts or as otherwise specified.
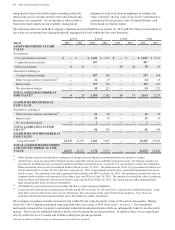
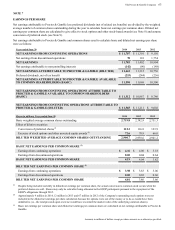
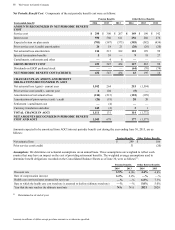
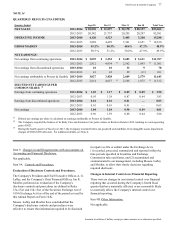
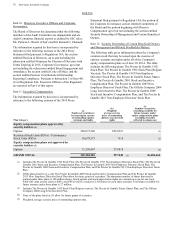
Net Periodic Benefit Cost. Components of the net periodic benefit cost were as follows:
Pension Benefits Other Retiree Benefits
Years ended June 30 2014 2013 2012 2014 2013 2012
AMOUNTS RECOGNIZED IN NET PERIODIC BENEFIT
COST
Service cost $ 298 $ 300 $ 267 $ 149 $ 190 $ 142
Interest cost 590 560 611 256 260 276
Expected return on plan assets (701)(587)(573)(385)(382)(434)
Prior service cost /(credit) amortization 26 18 21 (20)(20)(20)
Net actuarial loss amortization 214 213 102 118 199 99
Special termination benefits 539 — 918 27
Curtailments, settlements and other —46———
GROSS BENEFIT COST 432 547 434 127 265 90
Dividends on ESOP preferred stock ——— (64)(70)(74)
NET PERIODIC BENEFIT COST/(CREDIT) 432 547 434 63 195 16
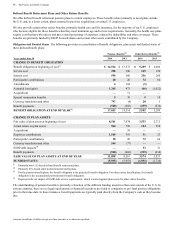
CHANGE IN PLAN ASSETS AND BENEFIT
OBLIGATIONS RECOGNIZED IN AOCI
Net actuarial loss /(gain) - current year 1,102 264 215 (1,594)
Prior service cost/(credit) - current year 4104 (5)—
Amortization of net actuarial loss (214)(213)(118)(199)
Amortization of prior service (cost) / credit (26)(18)20 20
Settlement / curtailment cost —(4)——
Currency translation and other 245 (2)21
TOTAL CHANGE IN AOCI 1,111 131 114 (1,772)
NET AMOUNTS RECOGNIZED IN PERIODIC BENEFIT
COST AND AOCI 1,543 678 177 (1,577)
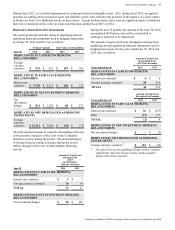
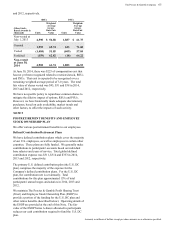
Amounts expected to be amortized from AOCI into net periodic benefit cost during the year ending June 30, 2015, are as
follows:
Pension Benefits Other Retiree Benefits
Net actuarial loss $ 299 $ 106
Prior service cost/(credit) 31 (20)
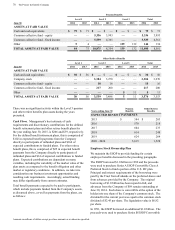
Assumptions.We determine our actuarial assumptions on an annual basis. These assumptions are weighted to reflect each
country that may have an impact on the cost of providing retirement benefits. The weighted average assumptions used to
determine benefit obligations recorded on the Consolidated Balance Sheets as of June 30, were as follows(1):
Pension Benefits Other Retiree Benefits
2014 2013 2014 2013
Discount rate 3.5% 4.0% 4.4% 4.8%
Rate of compensation increase 3.2% 3.2% —% —%
Health care cost trend rates assumed for next year —% —% 6.8% 7.3%
Rate to which the health care cost trend rate is assumed to decline (ultimate trend rate) —% —% 5.0% 5.0%
Year that the rate reaches the ultimate trend rate N/A N/A 2021 2020
(1) Determined as of end of year.