Proctor and Gamble 2014 Annual Report Download - page 45
Download and view the complete annual report
Please find page 45 of the 2014 Proctor and Gamble annual report below. You can navigate through the pages in the report by either clicking on the pages listed below, or by using the keyword search tool below to find specific information within the annual report.-
 1
1 -
2
-
3
-
4
-
5
-
6
-
7
-
8
-
9
-
10
-
11
-
12
-
13
-
14
-
15
-
16
-
17
-
18
-
19
-
20
-
21
-
22
-
23
-
24
-
25
-
26
-
27
-
28
-
29
-
30
-
31
-
32
-
33
-
34
-
 35
35 -
 36
36 -
 37
37 -
 38
38 -
 39
39 -
 40
40 -
 41
41 -
 42
42 -
 43
43 -
 44
44 -
 45
45 -
 46
46 -
 47
47 -
 48
48 -
 49
49 -
 50
50 -
 51
51 -
 52
52 -
 53
53 -
 54
54 -
 55
55 -
56
-
57
-
58
-
59
-
60
-
61
-
62
-
63
-
64
-
65
-
66
-
67
-
68
-
69
-
70
-
71
-
72
-
73
-
74
-
75
-
76
-
77
-
78
-
79
-
80
-
81
-
82
-
83
-
84
-
85
-
86
-
87
-
88
-
89
-
90
-
91
-
92
-
93
-
94
 |
 |

The Procter & Gamble Company 43
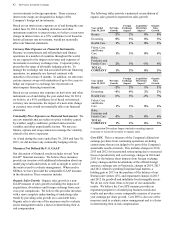
The table below provides a reconciliation of reported diluted
net earnings per share from continuing operations to Core
EPS:
Years ended June 30 2014 2013 2012
Diluted net earnings per
share - continuing
operations $ 3.98 $ 3.83 $ 3.06
Incremental restructuring
charges 0.12 0.18 0.20
Venezuela balance sheet
devaluation Impacts 0.09 0.08 —
Charges for pending
European legal matters 0.02 0.05 0.03
Gain on purchase of
balance of Iberian JV —(0.21) —
Impairment charges —0.10 0.51
Rounding 0.01 (0.01) (0.01)
CORE EPS 4.22 4.02 3.79
Core EPS Growth 5% 6% (1)%
Note - All reconciling items are presented net of tax. Tax effects are
calculated consistent with the nature of the underlying transaction.
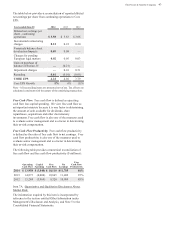
Free Cash Flow. Free cash flow is defined as operating
cash flow less capital spending. We view free cash flow as
an important measure because it is one factor in determining
the amount of cash available for dividends, share
repurchases, acquisitions and other discretionary
investments. Free cash flow is also one of the measures used
to evaluate senior management and is a factor in determining
their at-risk compensation.
Free Cash Flow Productivity. Free cash flow productivity
is defined as the ratio of free cash flow to net earnings. Free
cash flow productivity is also one of the measures used to
evaluate senior management and is a factor in determining
their at-risk compensation.
The following table provides a numerical reconciliation of
free cash flow and free cash flow productivity ($ millions):
Operating
Cash Flow
Capital
Spending
Free
Cash Flow
Net
Earnings
Free
Cash Flow
Productivity
2014 $ 13,958 $ (3,848) $ 10,110 $11,785 86%
2013 14,873 (4,008) 10,865 11,402 95 %
2012 13,284 (3,964) 9,320 10,904 85 %
Item 7A. Quantitative and Qualitative Disclosures About
Market Risk.
The information required by this item is incorporated by
reference to the section entitled Other Information under
Management's Disclosure and Analysis, and Note 5 to the
Consolidated Financial Statements.