Proctor and Gamble 2014 Annual Report Download - page 36
Download and view the complete annual report
Please find page 36 of the 2014 Proctor and Gamble annual report below. You can navigate through the pages in the report by either clicking on the pages listed below, or by using the keyword search tool below to find specific information within the annual report.-
 1
1 -
2
-
3
-
4
-
5
-
6
-
7
-
8
-
9
-
10
-
11
-
12
-
13
-
14
-
15
-
16
-
17
-
18
-
19
-
20
-
21
-
22
-
23
-
24
-
25
-
 26
26 -
 27
27 -
 28
28 -
 29
29 -
 30
30 -
 31
31 -
 32
32 -
 33
33 -
 34
34 -
 35
35 -
 36
36 -
 37
37 -
 38
38 -
 39
39 -
 40
40 -
 41
41 -
 42
42 -
 43
43 -
 44
44 -
 45
45 -
 46
46 -
47
-
48
-
49
-
50
-
51
-
52
-
53
-
54
-
55
-
56
-
57
-
58
-
59
-
60
-
61
-
62
-
63
-
64
-
65
-
66
-
67
-
68
-
69
-
70
-
71
-
72
-
73
-
74
-
75
-
76
-
77
-
78
-
79
-
80
-
81
-
82
-
83
-
84
-
85
-
86
-
87
-
88
-
89
-
90
-
91
-
92
-
93
-
94
 |
 |

34 The Procter & Gamble Company
digit increase in developing markets, behind innovation and
distribution expansion, and a low single-digit increase in
developed markets primarily due to the impact of reduced
pricing in North America. Global market share of the home
care category was unchanged. Batteries volume increased
low single digits due to a mid-single-digit increase in
developing regions from market growth and geographic
expansion, partially offset by a low single-digit decrease in
developed markets due to market contraction and share
losses, primarily behind higher pricing in Western Europe to
improve the margin structure. Global market share of the
batteries category was unchanged.
Net earnings increased 10% to $3.1 billion due to a 90-basis
point increase in net earnings margin and the increase in net
sales. Net earnings margin increased due to gross margin
expansion. Gross margin increased due to higher pricing and
manufacturing cost savings, partially offset by higher
commodity costs. SG&A as a percentage of net sales was
unchanged as higher marketing spending was offset by
reduced overhead costs.
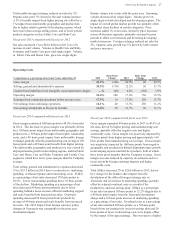
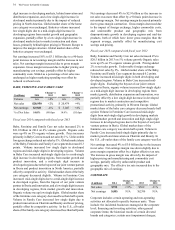
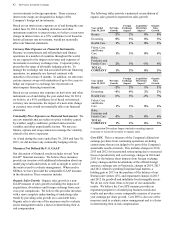
BABY, FEMININE AND FAMILY CARE
($ millions) 2014
Change vs
2013 2013
Change vs
2012
Volume n/a +4% n/a +5%
Net sales $20,950 +2% $ 20,479 +4%
Net earnings $2,940 -4% $ 3,047 +4%
% of Net Sales 14.0% (90) bps 14.9% (10) bps
Fiscal year 2014 compared with fiscal year 2013
Baby, Feminine and Family Care net sales increased 2% to
$21.0 billion in 2014 on 4% volume growth. Organic sales
were up 4% on 3% organic volume growth. Price increases
primarily in Baby Care increased net sales by 1%. Unfavorable
foreign exchange reduced net sales by 3%. Global market share
of the Baby, Feminine and Family Care segment decreased 0.3
points. Volume increased low single digits in developed
regions and mid-single digits in developing regions. Volume
in Baby Care increased mid-single digits due to a mid-single
digit increase in developing regions, from market growth and
product innovation, and a mid-single digit increase in
developed regions due to the buyout of our joint venture partner
in Iberia and product innovation in North America, partially
offset by competitive activity. Global market share of the baby
care category decreased slightly. Volume in Feminine Care
increased mid-single digits due to a mid-single digit increase
in developed regions, from the buyout of our joint venture
partner in Iberia and innovation, and a low single digit increase
in developing regions, from market growth and innovation.
Organic volume was up low single digits. Global market share
of the feminine care category decreased less than half a point.
Volume in Family Care increased low single digits due to
product innovation on Charmin and Bounty and lower pricing,
partially offset by competitive activity. In the U.S., all-outlet
share of the family care category decreased less than half point.
Net earnings decreased 4% to $2.9 billion as the increase in
net sales was more than offset by a 90-basis point decrease in
net earnings margin. Net earnings margin decreased primarily
due to gross margin contraction. Gross margin decreased due
to the impact of foreign exchange, higher commodity costs,
and unfavorable product and geographic mix from
disproportionate growth in developing regions and mid-tier
products, both of which have lower gross margins than the
segment average, partially offset by manufacturing cost
savings and pricing.
Fiscal year 2013 compared with fiscal year 2012
Baby, Feminine and Family Care net sales increased 4% to
$20.5 billion in 2013 on 5% volume growth. Organic sales
were up 6% on 3% organic volume growth. Pricing added
2% to net sales growth. Unfavorable foreign exchange
reduced net sales by 2%. Global market share of the Baby,
Feminine and Family Care segment decreased 0.2 points.
Volume increased mid-single digits in both developing and
developed regions. Volume in Baby Care increased mid-
single digits. Excluding the buyout of our joint venture
partner in Iberia, organic volume increased low-single digits
as a mid-single digit increase in developing regions from
market growth, distribution expansion and innovation, was
partially offset by a low single-digit decrease in developed
regions due to market contraction and competitive
promotional activity, primarily in Western Europe. Global
market share of the baby care category decreased nearly half
a point. Volume in Feminine Care increased mid-single
digits from mid-single-digit growth in developing markets
behind market growth and innovation and high single-digit
increase in developed regions due to the buyout of our joint
venture partner in Iberia. Global market share of the
feminine care category was down half a point. Volume in
Family Care increased mid-single digits primarily due to
market growth and innovation on Charmin and Bounty. In
the U.S., all-outlet share of the family care category was flat.
Net earnings increased 4% to $3.0 billion due to the increase
in net sales. Net earnings margin was down slightly due to
gross margin expansion offset by a higher effective tax rate.
The increase in gross margin was driven by the impact of
higher pricing and manufacturing and commodity cost
savings, partially offset by unfavorable product and
geographic mix. The effective tax rate increased due to the
geographic mix of earnings.
CORPORATE
($ millions) 2014
Change vs
2013 2013
Change vs
2012
Net sales $738 +31% $562 -31%
Net earnings $(48) N/A $(239) N/A
Corporate includes certain operating and non-operating
activities not allocated to specific business units. These
include: the incidental businesses managed at the corporate
level; financing and investing activities; other general
corporate items; the historical results of certain divested
brands and categories; certain asset impairment charges;