Proctor and Gamble 2014 Annual Report Download - page 52
Download and view the complete annual report
Please find page 52 of the 2014 Proctor and Gamble annual report below. You can navigate through the pages in the report by either clicking on the pages listed below, or by using the keyword search tool below to find specific information within the annual report.-
 1
1 -
2
-
3
-
4
-
5
-
6
-
7
-
8
-
9
-
10
-
11
-
12
-
13
-
14
-
15
-
16
-
17
-
18
-
19
-
20
-
21
-
22
-
23
-
24
-
25
-
26
-
27
-
28
-
29
-
30
-
31
-
32
-
33
-
34
-
35
-
36
-
37
-
38
-
39
-
40
-
41
-
 42
42 -
 43
43 -
 44
44 -
 45
45 -
 46
46 -
 47
47 -
 48
48 -
 49
49 -
 50
50 -
 51
51 -
 52
52 -
 53
53 -
 54
54 -
 55
55 -
 56
56 -
 57
57 -
 58
58 -
 59
59 -
 60
60 -
 61
61 -
 62
62 -
63
-
64
-
65
-
66
-
67
-
68
-
69
-
70
-
71
-
72
-
73
-
74
-
75
-
76
-
77
-
78
-
79
-
80
-
81
-
82
-
83
-
84
-
85
-
86
-
87
-
88
-
89
-
90
-
91
-
92
-
93
-
94
 |
 |

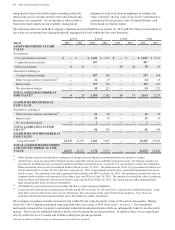
50 The Procter & Gamble Company
See accompanying Notes to Consolidated Financial Statements.
Consolidated Statements of Shareholders' Equity
Dollars in millions/
Shares in thousands
Common
Shares
Outstanding
Common
Stock
Preferred
Stock
Addition
al
Paid-In
Capital
Reserve
for
ESOP
Debt
Retirement
Accumula
ted
Other
Compreh
ensive
Income/
(Loss)
Treasury
Stock
Retained
Earnings
Non-
controlling
Interest Total
BALANCE JUNE 30, 2011 2,765,737 $ 4,008 $ 1,234 $62,405 $ (1,357) $ (2,054) $(67,278) $70,682 $ 361 $68,001
Net earnings 10,756 148 10,904
Other comprehensive loss (7,279) (7,279)
Dividends to shareholders:
Common (5,883) (5,883)
Preferred, net of tax benefits (256) (256)
Treasury purchases (61,826) (4,024) (4,024)
Employee plan issuances 39,546 550 1,665 2,215
Preferred stock conversions 4,576 (39) 6 33 —
ESOP debt impacts 50 50
Noncontrolling interest, net 220 87 307
BALANCE JUNE 30, 2012 2,748,033 4,008 1,195 63,181 (1,357) (9,333) (69,604) 75,349 596 64,035
Net earnings 11,312 90 11,402
Other comprehensive income 1,834 1,834
Dividends to shareholders:
Common (6,275) (6,275)
Preferred, net of tax benefits (244) (244)
Treasury purchases (84,234) (5,986) (5,986)
Employee plan issuances 70,923 1 352 3,573 3,926
Preferred stock conversions 7,605 (58) 7 51 —
ESOP debt impacts 5 55 60
Noncontrolling interest, net (2) (41) (43)
BALANCE JUNE 30, 2013 2,742,327 4,009 1,137 63,538 (1,352) (7,499) (71,966) 80,197 645 68,709
Net earnings 11,643 142 11,785
Other comprehensive loss (163) (163)
Dividends to shareholders:
Common (6,658) (6,658)
Preferred, net of tax benefits (253) (253)
Treasury purchases (74,987) (6,005) (6,005)
Employee plan issuances 40,288 364 2,144 2,508
Preferred stock conversions 3,178 (26) 4 22 —
ESOP debt impacts 12 61 73
Noncontrolling interest, net 5 (25) (20)
BALANCE JUNE 30, 2014 2,710,806 $ 4,009 $ 1,111 $63,911 $ (1,340) $ (7,662) $(75,805) $84,990 $ 762 $69,976