Proctor and Gamble 2014 Annual Report Download - page 33
Download and view the complete annual report
Please find page 33 of the 2014 Proctor and Gamble annual report below. You can navigate through the pages in the report by either clicking on the pages listed below, or by using the keyword search tool below to find specific information within the annual report.-
 1
1 -
2
-
3
-
4
-
5
-
6
-
7
-
8
-
9
-
10
-
11
-
12
-
13
-
14
-
15
-
16
-
17
-
18
-
19
-
20
-
21
-
22
-
 23
23 -
 24
24 -
 25
25 -
 26
26 -
 27
27 -
 28
28 -
 29
29 -
 30
30 -
 31
31 -
 32
32 -
 33
33 -
 34
34 -
 35
35 -
 36
36 -
 37
37 -
 38
38 -
 39
39 -
 40
40 -
 41
41 -
 42
42 -
 43
43 -
44
-
45
-
46
-
47
-
48
-
49
-
50
-
51
-
52
-
53
-
54
-
55
-
56
-
57
-
58
-
59
-
60
-
61
-
62
-
63
-
64
-
65
-
66
-
67
-
68
-
69
-
70
-
71
-
72
-
73
-
74
-
75
-
76
-
77
-
78
-
79
-
80
-
81
-
82
-
83
-
84
-
85
-
86
-
87
-
88
-
89
-
90
-
91
-
92
-
93
-
94
 |
 |

The Procter & Gamble Company 31
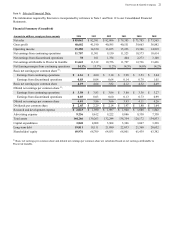
Net Sales Change Drivers (2014 vs. 2013)
Volume with
Acquisitions
& Divestitures
Volume
Excluding
Acquisitions
& Divestitures
Foreign
Exchange Price Mix Other
Net Sales
Growth
Beauty 0% 0% -2% 0% 0% 0% -2%
Grooming 1% 1% -3% 4% -2% 0% 0%
Health Care 2% 2% -1% 1% -1% 0% 1%
Fabric Care and Home Care 5% 5% -3% 0% -1% 0% 1%
Baby, Feminine and Family
Care 4% 3% -3% 1% 0% 0% 2%
TOTAL COMPANY 3% 3% -2% 1% -1% 0% 1%
Net Sales Change Drivers (2013 vs. 2012)
Volume with
Acquisitions
& Divestitures
Volume
Excluding
Acquisitions
& Divestitures
Foreign
Exchange Price Mix Other
Net Sales
Growth
Beauty 0% 0% -2% 2% -1% -1% -2%
Grooming -1% 0% -4% 2% 0% -1% -4%
Health Care 5% 4% -3% 1% 2% 1% 6%
Fabric Care and Home Care 3% 3% -3% 1% 0% 0% 1%
Baby, Feminine and Family
Care 5% 3% -2% 2% 0% -1% 4%
TOTAL COMPANY 2% 2% -2% 1% 0% 0% 1%
Net sales percentage changes are approximations based on quantitative formulas that are consistently applied. Other includes the sales
mix impact from acquisitions and divestitures and rounding impacts necessary to reconcile volume to net sales.
BEAUTY
($ millions) 2014
Change vs
2013 2013
Change vs
2012
Volume n/a 0% n/a 0%
Net sales $19,507 -2% $19,956 -2%
Net earnings $2,739 +11% $2,474 +4%
% of Net Sales 14.0% 160 bps 12.4% 60 bps
Fiscal year 2014 compared with fiscal year 2013
Beauty net sales decreased 2% to $19.5 billion in 2014. Unit
volume was in line with the prior year period as overall
market growth was offset by share declines from the impacts
of competitive activity. Organic sales were flat.
Unfavorable foreign exchange reduced net sales by 2%.
Global market share of the Beauty segment decreased 0.4
points. Volume increased low single digits in developing
markets and declined low single digits in developed markets.
Volume in Hair Care and Color was flat with decreases in
developed regions offset by an increase in developing
regions. Global market share of the hair care category
decreased nearly half a point. Volume in Beauty Care
increased low single digits due to product and commercial
innovation and market growth for personal cleansing and
deodorants, partially offset by a decrease in facial skin care
due to competitive activity. Global market share of the
beauty care category decreased nearly half a point. Volume
in Salon Professional decreased mid-single digits due to
competitive activity and European market contraction.
Volume in Prestige decreased low single digits due to minor
brand divestitures.
Net earnings increased 11% to $2.7 billion due to a 160 basis
point increase in net earnings margin. Net earnings margin
increased due to a decrease in SG&A and a gain on a minor
brand divestiture (Pert in Latin America), partially offset by
gross margin contraction. SG&A decreased primarily due to
a reduction in marketing spending resulting from
optimization efforts. Gross margin decreased slightly due to
the impact of foreign exchange and negative geographic and
product mix, partially offset by manufacturing cost savings.
Fiscal year 2013 compared with fiscal year 2012
Beauty net sales decreased 2% to $20.0 billion in 2013 on
unit volume that was in line with the prior year period.
Organic sales increased 1%. Price increases contributed 2%
to net sales growth. Unfavorable geographic mix reduced
net sales by 1% due to disproportionate growth in
developing regions, which have lower than segment average
selling prices. Unfavorable foreign exchange reduced net
sales by 2%. The mix impact of minor brand divestitures
reduced net sales by 1%. Global market share of the Beauty
segment decreased 0.5 points. Volume increased low single
digits in developing markets and decreased low single digits
in developed regions. Volume in Hair Care and Color was in
line with the prior year period due to a low single-digit
increase in developing regions from market growth and
innovation offset by a low single-digit decline in developed