Proctor and Gamble 2011 Annual Report Download - page 73
Download and view the complete annual report
Please find page 73 of the 2011 Proctor and Gamble annual report below. You can navigate through the pages in the report by either clicking on the pages listed below, or by using the keyword search tool below to find specific information within the annual report.-
 1
1 -
2
-
3
-
4
-
5
-
6
-
7
-
8
-
9
-
10
-
11
-
12
-
13
-
14
-
15
-
16
-
17
-
18
-
19
-
20
-
21
-
22
-
23
-
24
-
25
-
26
-
27
-
28
-
29
-
30
-
31
-
32
-
33
-
34
-
35
-
36
-
37
-
38
-
39
-
40
-
41
-
42
-
43
-
44
-
45
-
46
-
47
-
48
-
49
-
50
-
51
-
52
-
53
-
54
-
55
-
56
-
57
-
58
-
59
-
60
-
61
-
62
-
 63
63 -
 64
64 -
 65
65 -
 66
66 -
 67
67 -
 68
68 -
 69
69 -
 70
70 -
 71
71 -
 72
72 -
 73
73 -
 74
74 -
 75
75 -
 76
76 -
 77
77 -
 78
78 -
 79
79 -
 80
80 -
 81
81 -
 82
82
 |
 |
Notes to Consolidated Financial StatementsThe Procter & Gamble Company 71
Amounts in millions of dollars except per share amounts or as otherwise specified.
Several regulatory authorities in Europe have issued separate complaints
pursuant to their investigations alleging that the Company, along
with several other companies, engaged in violations of competition
laws in those countries. The remaining authorities’ investigations are
in various stages of the regulatory process. As a result of our initial
and on-going analyses of the complaints, as well as final decisions
issued by the European Commission and authorities in a number of
other countries in fiscal , the Company has reserves totaling
$ as of June 30,2011, for fines for competition law violations.
Inaccordance with U.S.GAAP, certain of the reserves included in this
amount represent the low end of a range of potential outcomes.
Accordingly, the ultimate resolution of these matters may result in
fines or costs in excess of the amounts reserved that could materially
impact our income statement and cash flows in the period in which
they are accrued and paid, respectively. We will continue to monitor
developments for all of these investigations and will record additional
charges as appropriate.
With respect to other litigation and claims, while considerable uncer-
tainty exists, in the opinion of management and our counsel, the
ultimate resolution of the various lawsuits and claims will not materially
affect our financial position, results of operations or cash flows.
We are also subject to contingencies pursuant to environmental laws
and regulations that in the future may require us to take action to
correct the effects on the environment of prior manufacturing and
waste disposal practices. Based on currently available information, we
do not believe the ultimate resolution of environmental remediation
will have a material adverse effect on our financial position, results of
operations or cash flows.
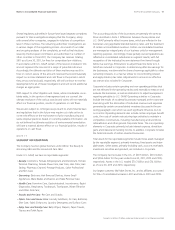
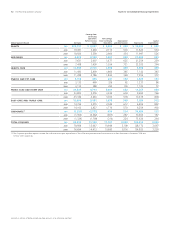
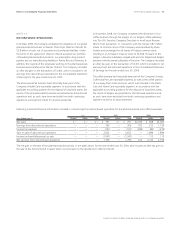
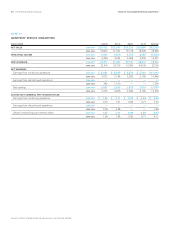
NOTE 11
SEGMENT INFORMATION
The Company has two global business units (GBUs): the Beauty &
Grooming GBU and the Household Care GBU.
Under U.S. GAAP, we have six reportable segments:
ō Beauty: Cosmetics, Female Antiperspirant and Deodorant, Female
Personal Cleansing, Female Shave Care, Hair Care, Hair Color, Hair
Styling, Pharmacy Channel, Prestige Products, Salon Professional
and Skin Care;
ō Grooming: Electronic Hair Removal Devices, Home Small
Appliances, Male Blades and Razors and Male Personal Care;
ō Health Care: Feminine Care, Gastrointestinal, Incontinence, Rapid
Diagnostics, Respiratory, Toothbrush, Toothpaste, Water Filtration
and Other Oral Care;
ō Snacks and Pet Care: Pet Care and Snacks;
ō Fabric Care and Home Care: Laundry Additives, Air Care, Batteries,
Dish Care, Fabric Enhancers, Laundry Detergents and Surface Care;
ō Baby Care and Family Care: Baby Wipes, Diapers, Paper Towels,
Tissues and Toilet Paper.
The accounting policies of the businesses are generally the same as
those described in Note 1. Differences between these policies and
U.S. GAAP primarily reflect income taxes, which are reflected in the
businesses using applicable blended statutory rates, and the treatment
of certain unconsolidated investees. Certain unconsolidated investees
are managed as integral parts of our business units for management
reporting purposes. Accordingly, these partially owned operations are
reflected as consolidated subsidiaries in segment results, with full
recognition of the individual income statement line items through
before-tax earnings. Eliminations to adjust these line items to U.S.
GAAP are included in Corporate. In determining after-tax earnings for
the businesses, we eliminate the share of earnings applicable to other
ownership interests, in a manner similar to noncontrolling interest
and apply statutory tax rates. Adjustments to arrive at our effective
tax rate are also included in Corporate.
Corporate includes certain operating and non-operating activities that
are not reflected in the operating results used internally to measure and
evaluate the businesses, as well as eliminations to adjust management
reporting principles to U.S. GAAP. Operating activities in Corporate
include the results of incidental businesses managed at the corporate
level along with the elimination of individual revenues and expenses
generated by certain unconsolidated investees discussed in the pre-
ceding paragraph over which we exert significant influence, but do
not control. Operating elements also include certain employee benefit
costs, the costs of certain restructuring-type activities to maintain a
competitive cost structure, including manufacturing and workforce
rationalization and other general Corporate items. The non-operating
elements in Corporate primarily include interest expense, divestiture
gains and interest and investing income. In addition, Corporate includes
the historical results of certain divested businesses.
Total assets for the reportable segments include those assets managed
by the reportable segment, primarily inventory, fixed assets and intan-
gible assets. Other assets, primarily including cash, accounts receivable,
investment securities and goodwill, are included in Corporate.
The Company had net sales in the U.S. of $30.5billion, $30.0billion
and $29.6billion for the years ended June30,2011,2010 and 2009,
respectively. Assets in the U.S. totaled $70.3billion and $70.1billion
as of June30,2011 and 2010, respectively.
Our largest customer, Wal-Mart Stores, Inc. and its affiliates, accounted
for 15% of consolidated net sales in 2011 and 16% in 2010 and 2009.