Proctor and Gamble 2011 Annual Report Download - page 56
Download and view the complete annual report
Please find page 56 of the 2011 Proctor and Gamble annual report below. You can navigate through the pages in the report by either clicking on the pages listed below, or by using the keyword search tool below to find specific information within the annual report.-
 1
1 -
2
-
3
-
4
-
5
-
6
-
7
-
8
-
9
-
10
-
11
-
12
-
13
-
14
-
15
-
16
-
17
-
18
-
19
-
20
-
21
-
22
-
23
-
24
-
25
-
26
-
27
-
28
-
29
-
30
-
31
-
32
-
33
-
34
-
35
-
36
-
37
-
38
-
39
-
40
-
41
-
42
-
43
-
44
-
45
-
 46
46 -
 47
47 -
 48
48 -
 49
49 -
 50
50 -
 51
51 -
 52
52 -
 53
53 -
 54
54 -
 55
55 -
 56
56 -
 57
57 -
 58
58 -
 59
59 -
 60
60 -
 61
61 -
 62
62 -
 63
63 -
 64
64 -
 65
65 -
 66
66 -
67
-
68
-
69
-
70
-
71
-
72
-
73
-
74
-
75
-
76
-
77
-
78
-
79
-
80
-
81
-
82
 |
 |

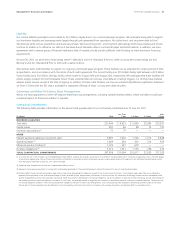
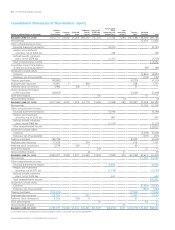
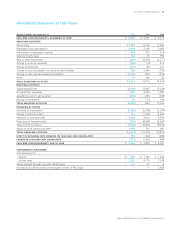
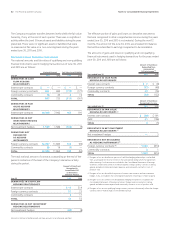
54 The Procter & Gamble Company
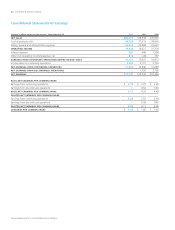
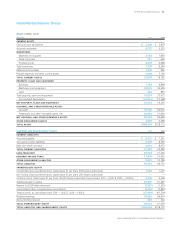
See accompanying Notes to Consolidated Financial Statements.
Dollarsinmillions/Sharesinthousands
Common
Shares
OutstandingCommon
StockPreferred
Stock
Additional
Paid-In
Capital
Reservefor
ESOP Debt
Retirement
Accumulated
Other
Comprehensive
Income/(loss)
Non
controlling
Interest
-
Treasury
Stock
Retained
Earnings Total
BALANCE JUNE , 3,032,717 $4,002 $1,366 $60,307 $(1,325) $ 3,746 $290 $(47,588) $48,986 $69,784
Net earnings 13,436 13,436
Other comprehensive income:
Financial statement translation (6,151)(6,151)
Hedges and investment
securities, net of $ tax 748 748
Defined benefit retirement
plans, net of $879 tax (1,701)(1,701)
Total comprehensive income $ 6,332
Cumulative impact for adoption
of new accounting guidance(1)(84)(84)
Dividends to shareholders:
Common (4,852)(4,852)
Preferred, net of tax benefits (192)(192)
Treasury purchases (98,862) (6,370)(6,370)
Employee plan issuances 16,841 5804 428 1,237
Preferred stock conversions 4,992 (42) 7 35 —
Shares tendered for Folgers
coffee subsidiary (38,653) (2,466)(2,466)
ESOP debt impacts (15)15 —
Noncontrolling interest (7)(7)
BALANCE JUNE , 2,917,035 4,007 1,324 61,118 (1,340)(3,358)283 (55,961) 57,309 63,382
Net earnings 12,736 12,736
Other comprehensive income:
Financial statement translation (4,194)(4,194)
Hedges and investment
securities, net of $520 tax 867 867
Defined benefit retirement
plans, net of $465 tax (1,137)(1,137)
Total comprehensive income $8,272
Dividends to shareholders:
Common (5,239)(5,239)
Preferred, net of tax benefits (219)(219)
Treasury purchases (96,759) (6,004)(6,004)
Employee plan issuances 17,616 1574616 1,191
Preferred stock conversions 5,579 (47) 740 —
ESOP debt impacts (10)27 17
Noncontrolling interest (2)41 39
BALANCE JUNE , 2,843,471 4,008 1,27761,697 (1,350)(7,822)324 (61,309) 64,614 61,439
Net earnings 11,797 11,797
Other comprehensive income:
Financial statement translation 6,493 6,493
Hedges and investment
securities, net of $711 tax (1,178) (1,178)
Defined benefit retirement
plans, net of $302 tax 453 453
Total comprehensive income $17,565
Dividends to shareholders:
Common (5,534) (5,534)
Preferred, net of tax benefits (233)(233)
Treasury purchases (112,729) (7,039) (7,039)
Employee plan issuances 29,729 — 702 1,033 1,735
Preferred stock conversions 5,266 (43) 6 37 —
ESOP debt impacts (7)38 31
Noncontrolling interest — 37 37
BALANCE JUNE , 2,765,737 $4,008 $1,234 $62,405 $(1,357)$(2,054)$361 $(67,278) $70,682 $68,001
(1) Cumulative impact of adopting new accounting guidance relates to split-dollar life insurance arrangements.
Consolidated Statements of Shareholders’ Equity