Proctor and Gamble 2011 Annual Report Download - page 55
Download and view the complete annual report
Please find page 55 of the 2011 Proctor and Gamble annual report below. You can navigate through the pages in the report by either clicking on the pages listed below, or by using the keyword search tool below to find specific information within the annual report.-
 1
1 -
2
-
3
-
4
-
5
-
6
-
7
-
8
-
9
-
10
-
11
-
12
-
13
-
14
-
15
-
16
-
17
-
18
-
19
-
20
-
21
-
22
-
23
-
24
-
25
-
26
-
27
-
28
-
29
-
30
-
31
-
32
-
33
-
34
-
35
-
36
-
37
-
38
-
39
-
40
-
41
-
42
-
43
-
44
-
 45
45 -
 46
46 -
 47
47 -
 48
48 -
 49
49 -
 50
50 -
 51
51 -
 52
52 -
 53
53 -
 54
54 -
 55
55 -
 56
56 -
 57
57 -
 58
58 -
 59
59 -
 60
60 -
 61
61 -
 62
62 -
 63
63 -
 64
64 -
 65
65 -
66
-
67
-
68
-
69
-
70
-
71
-
72
-
73
-
74
-
75
-
76
-
77
-
78
-
79
-
80
-
81
-
82
 |
 |

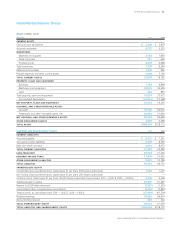
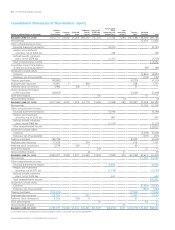
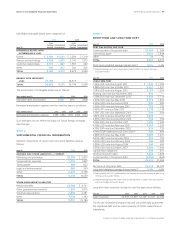
The Procter & Gamble Company 53
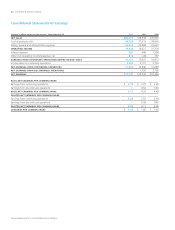
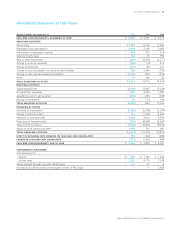
See accompanying Notes to Consolidated Financial Statements.
Amounts in millions; June30
Assets 2010
CURRENT ASSETS
Cash and cash equivalents $2,768 $2,879
Accounts receivable 6,275 5,335
INVENTORIES
Materials and supplies 2,153 1,692
Work in process717 604
Finished goods 4,509 4,088
Total inventories 7,379 6,384
Deferred income taxes 1,140 990
Prepaid expenses and other current assets 4,408 3,194
TOTAL CURRENT ASSETS 21,970 18,782
PROPERTY, PLANT AND EQUIPMENT
Buildings 7,753 6,868
Machinery and equipment 32,820 29,294
Land 934 850
Total property, plant and equipment 41,507 37,012
Accumulated depreciation (20,214)(17,768)
NET PROPERTY, PLANT AND EQUIPMENT 21,293 19,244
GOODWILL AND OTHER INTANGIBLE ASSETS
Goodwill57,562 54,012
Trademarks and other intangible assets, net 32,620 31,636
NET GOODWILL AND OTHER INTANGIBLE ASSETS 90,182 85,648
OTHER NONCURRENT ASSETS 4,909 4,498
TOTAL ASSETS $138,354 $128,172
Liabilities and Shareholders’ Equity 2010
CURRENT LIABILITIES
Accounts payable $8,022 $7,251
Accrued and other liabilities 9,290 8,559
Debt due within one year 9,981 8,472
TOTAL CURRENT LIABILITIES 27,293 24,282
LONG-TERM DEBT 22,033 21,360
DEFERRED INCOME TAXES 11,070 10,902
OTHER NONCURRENT LIABILITIES9,957 10,189
TOTAL LIABILITIES 70,353 66,733
SHAREHOLDERS’ EQUITY
Convertible ClassA preferred stock, stated value $1per share (600 shares authorized) 1,234 1,277
Non-Voting Class B preferred stock, stated value $1per share (200 shares authorized) ——
Common stock, stated value $1per share (10,000 shares authorized; shares issued: 2011—4,007.9,2010 —4,007.6)4,008 4,008
Additional paid-in capital 62,405 61,697
Reserve for ESOP debt retirement (1,357) (1,350)
Accumulated other comprehensive income/(loss) (2,054) (7,822)
Treasury stock, at cost (shares held: 2011—1,242.2,2010—1,164.1)(67,278)(61,309)
Retained earnings 70,682 64,614
Noncontrolling interest 361 324
TOTAL SHAREHOLDERS’ EQUITY68,001 61,439
TOTAL LIABILITIES AND SHAREHOLDERS’ EQUITY$138,354 $128,172
Consolidated Balance Sheets