Proctor and Gamble 2011 Annual Report Download - page 66
Download and view the complete annual report
Please find page 66 of the 2011 Proctor and Gamble annual report below. You can navigate through the pages in the report by either clicking on the pages listed below, or by using the keyword search tool below to find specific information within the annual report.-
 1
1 -
2
-
3
-
4
-
5
-
6
-
7
-
8
-
9
-
10
-
11
-
12
-
13
-
14
-
15
-
16
-
17
-
18
-
19
-
20
-
21
-
22
-
23
-
24
-
25
-
26
-
27
-
28
-
29
-
30
-
31
-
32
-
33
-
34
-
35
-
36
-
37
-
38
-
39
-
40
-
41
-
42
-
43
-
44
-
45
-
46
-
47
-
48
-
49
-
50
-
51
-
52
-
53
-
54
-
55
-
 56
56 -
 57
57 -
 58
58 -
 59
59 -
 60
60 -
 61
61 -
 62
62 -
 63
63 -
 64
64 -
 65
65 -
 66
66 -
 67
67 -
 68
68 -
 69
69 -
 70
70 -
 71
71 -
 72
72 -
 73
73 -
 74
74 -
 75
75 -
 76
76 -
77
-
78
-
79
-
80
-
81
-
82
 |
 |
64 The Procter & Gamble CompanyNotes to Consolidated Financial Statements
Amounts in millions of dollars except per share amounts or as otherwise specified.
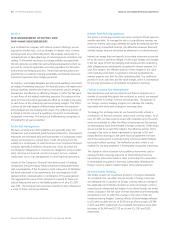
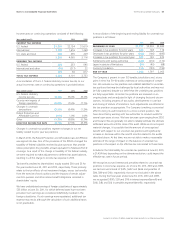
Lattice-based option valuation models incorporate ranges of assump-
tions for inputs and those ranges are disclosed in the preceding table.
Expected volatilities are based on a combination of historical volatility of
our stock and implied volatilities of call options on our stock. We use
historical data to estimate option exercise and employee termination
patterns within the valuation model. The expected life of options
granted is derived from the output of the option valuation model and
represents the average period of time that options granted are expected
to be outstanding. The interest rate for periods within the contractual
life of the options is based on the U.S. Treasury yield curve in effect at
the time of grant.
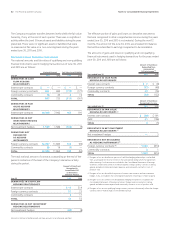
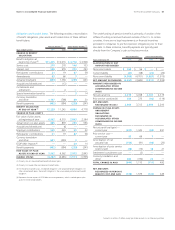
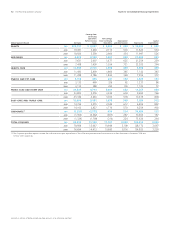
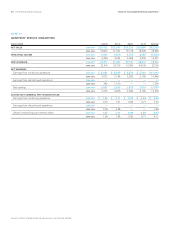
A summary of options outstanding under the plans as of June30,2011,
and activity during the year then ended is presented below:
Options in thousands Options
WeightedAvg
ExercisePrice
.
Weighted Avg
Remaining
Contractual
LifeinYears
.
Aggregate
Intrinsic Value
(in millions)
Outstanding,
beginning of year364,971 $50.16
Granted29,141 62.85
Exercised (29,065)42.55
Canceled(1,873) 57.81
OUTSTANDING,
ENDOF YEAR 363,174 51.75 5.3 $4,398
EXERCISABLE 271,096 49.69 4.23,837
The weighted average grant-date fair value of options granted was
$11.09, $13.47 and $11.67 per share in 2011,2010 and 2009, respectively.
The total intrinsic value of options exercised was $628, $342 and
$434 in 2011,2010 and 2009, respectively. The total grant-date fair
value of options that vested during 2011,2010 and 2009 was $445,
$563 and $537, respectively. We have no specific policy to repurchase
common shares to mitigate the dilutive impact of options; however,
we have historically made adequate discretionary purchases, based
on cash availability, market trends and other factors, to satisfy stock
option exercise activity.
At June30,2011, there was $372 of compensation cost that has not yet
been recognized related to stock option grants. That cost is expected
to be recognized over a remaining weighted average period of 1.8years.
At June 30,2011, there was $98 of compensation cost that has not
yet been recognized related to restricted stock, RSUs and PSUs. That
cost is expected to be recognized over a remaining weighted average
period of 3.0years.
Cash received from options exercised was $1,237, $703 and $639 in
2011,2010 and 2009, respectively. The actual tax benefit realized for
the tax deductions from option exercises totaled $188, $89 and $146
in 2011,2010 and 2009, respectively.
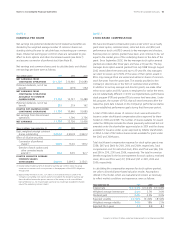
NOTE 8
POSTRETIREMENT BENEFITS AND
EMPLOYEE STOCK OWNERSHIP PLAN
We offer various postretirement benefits to our employees.
Defined Contribution Retirement Plans
We have defined contribution plans which cover the majority of our
U.S. employees, as well as employees in certain other countries.
These plans are fully funded. We generally make contributions to
participants’ accounts based on individual base salaries and years of
service. Total global defined contribution expense was $347, $344
and $364 in 2011,2010 and 2009, respectively.
The primary U.S. defined contribution plan (the U.S. DC plan) com-
prises the majority of the balances and expense for the Company’s
defined contribution plans. For the U.S. DC plan, the contribution rate
is set annually. Total contributions for this plan approximated 15% of
total participants’ annual wages and salaries in 2011,2010 and 2009.
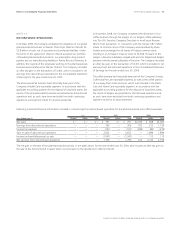
We maintain The Procter& Gamble Profit Sharing Trust (Trust) and
Employee Stock Ownership Plan (ESOP) to provide a portion of the
funding for the U.S. DC plan and other retiree benefits. Operating
details of the ESOP are provided at the end of this Note. The fair
value of the ESOP Series A shares allocated to participants reduces
our cash contribution required to fund the U.S. DC plan.
Defined Benefit Retirement Plans and Other Retiree Benefits
We offer defined benefit retirement pension plans to certain employ-
ees. These benefits relate primarily to local plans outside the U.S. and,
to a lesser extent, plans assumed in previous acquisitions covering
U.S. employees.
We also provide certain other retiree benefits, primarily health care
and life insurance, for the majority of our U.S. employees who
become eligible for these benefits when they meet minimum age and
service requirements. Generally, the health care plans require cost
sharing with retirees and pay a stated percentage of expenses,
reduced by deductibles and other coverages. These benefits are
primarily funded by ESOP Series B shares and certain other assets
contributed by the Company.