Proctor and Gamble 2011 Annual Report Download - page 45
Download and view the complete annual report
Please find page 45 of the 2011 Proctor and Gamble annual report below. You can navigate through the pages in the report by either clicking on the pages listed below, or by using the keyword search tool below to find specific information within the annual report.-
 1
1 -
2
-
3
-
4
-
5
-
6
-
7
-
8
-
9
-
10
-
11
-
12
-
13
-
14
-
15
-
16
-
17
-
18
-
19
-
20
-
21
-
22
-
23
-
24
-
25
-
26
-
27
-
28
-
29
-
30
-
31
-
32
-
33
-
34
-
 35
35 -
 36
36 -
 37
37 -
 38
38 -
 39
39 -
 40
40 -
 41
41 -
 42
42 -
 43
43 -
 44
44 -
 45
45 -
 46
46 -
 47
47 -
 48
48 -
 49
49 -
 50
50 -
 51
51 -
 52
52 -
 53
53 -
 54
54 -
 55
55 -
56
-
57
-
58
-
59
-
60
-
61
-
62
-
63
-
64
-
65
-
66
-
67
-
68
-
69
-
70
-
71
-
72
-
73
-
74
-
75
-
76
-
77
-
78
-
79
-
80
-
81
-
82
 |
 |

Management’s Discussion and AnalysisThe Procter & Gamble Company 43
developing regions, which have lower than segment average selling
prices. Organic sales increased %. Volume grew mid-single digits in
developing regions and low single digits in developed regions. Oral
Care volume grew mid-single digits behind initiative activity in
Western Europe, Latin America and Asia. Personal Health Care volume
was up low single digits behind higher shipments of Vicks and diag-
nostic products, partially offset by a continuing decline of PrilosecOTC
in North America due to increased competitive activity. All-outlet value
share of the U.S. personal health care market declined 1-share point,
led by a 5-share point decline of Prilosec OTC’s share of the upper
stomach remedies segment. Feminine Care volume increased low single
digits behind initiative-driven growth of Always and expansion of
Naturella into China. Global market share of the feminine care category
was down about half a point.
Net earnings increased 1% to $1.9billion for 2010 on higher net sales,
partially offset by a 10-basis point reduction in net earnings margin. Net
earnings margin contracted due to higher SG&A as a percentage of net
sales, partially offset by higher gross margin. SG&A as a percentage
of net sales increased due to higher marketing and overhead spending
and incremental foreign currency exchange costs. Gross margin grew
behind price increases, lower commodity costs and manufacturing
cost savings.
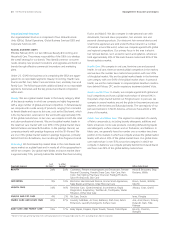
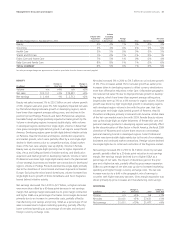
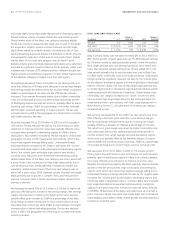
SNACKS AND PET CARE
($ millions) 2011
Changevs.
Prior Year 2010
Changevs.
Prior Year
Volume n/a +1% n/a -2%
Net sales $3,156 +1%$3,135 +1%
Net earnings $241 -26%$326 +39%
Snacks and Pet Care net sales increased 1% to $3.2billion on a 1%
increase in unit volume. Organic sales, which exclude the impacts of
foreign exchange and the Natura acquisition, were down 5% on a 2%
decline in organic volume. Price decreases, through higher promo-
tional spending, reduced net sales growth by 1%. Favorable foreign
exchange positively impacted net sales growth by 1%. Snacks volume
increased high single digits mainly due to increased distribution in
CEEMEA and Latin America, as well as initiatives and incremental
merchandising activity. Global market share of the snacks category
was up slightly. Pet Care volume was down mid-single digits mainly
due to the impacts of the recall of select dry pet food products and
the supply constraints resulting from restructuring the supply chain
following the recalls, partially offset by the impact of the Natura
acquisition in June 2010. Excluding the Natura acquisition, Pet Care
volume decreased double digits. Global market share of the pet care
category was down half a point.
Net earnings decreased 26%to $241 million as sales growth was more
than offset by a 280-basis point decrease in net earnings margin.
Netearnings margin decreased due to operating margin contraction
partially offset by a lower effective tax rate. The operating margin
reduction was driven by lower gross margin and increased SG&A as
apercentage of net sales. Gross margin declined behind incremental
costs and reduced scale leverage related to the pet food recall and
supply chain restructuring efforts. SG&A as a percentage of net sales
increased due to costs related to the select dry pet food products
recall. The tax rate decrease was due to a shift in the geographic mix
of earnings to countries with lower statutory tax rates.
In April 2011, we announced plans to divest the Company’s Snacks
business through a merger with Diamond Foods, Inc. in an all-stock
Reverse Morris Trust transaction. The Snacks business had net sales
ofapproximately $1.5billion and operating income of approximately
$200 million in fiscal 2011. The Company expects the transaction
toclose by the end of the 2011 calendar year, pending necessary
regulatory approvals.
Net sales increased 1% in 2010 to $3.1billion on a 2% decline in unit
volume. Price increases, taken primarily to offset prior-year commodity
cost increases, added 3% to net sales. Favorable foreign exchange
added 1% to net sales. Mix reduced net sales by 1% due to the dis-
continuation of certain premium snack products, which have higher
than segment average selling prices, and higher shipments of large
size pet products, which have lower than segment average selling
prices. Organic sales were in line with the prior year. Volume in Snacks
was down mid-single digits behind volume share losses driven by
lower merchandising activity in North America and the discontinuation
of certain premium snack products. Global market share of the snacks
category was down half a point versus the prior year. Volume in Pet
Care was up low single digits behind the continued success of product
initiatives, increased marketing support and incremental merchandising
activity.
Net earnings increased 39% to $326 million in 2010 driven by higher
net sales and a 290-basis point increase in net earnings margin. Net
earnings margin expanded due to higher gross margin and a lower
tax rate, partially offset by higher SG&A as a percentage of net sales.
Gross margin expanded behind price increases, commodity cost declines
and manufacturing cost savings. The tax rate declined due to a shift
in the geographic mix of earnings to countries with lower statutory
tax rates. SG&A as a percentage of net sales increased due to higher
marketing and overhead spending.
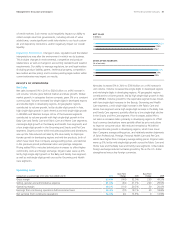
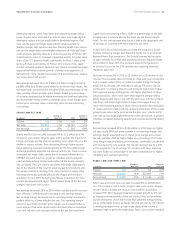
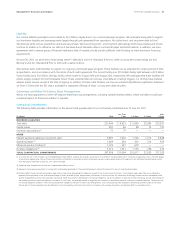
FABRIC CARE AND HOME CARE
($ millions) 2011
Changevs.
PriorYear 2010
Changevs.
Prior Year
Volume n/a +7%n/a +6%
Net sales $24,837 +4%$23,805 +3%
Net earnings $3,009 -10%$3,339 +10%
Fabric Care and Home Care net sales increased 4% to $24.8billion
ona7% increase in unit volume. Organic sales were up 3%. Organic
volume, which excludes the impact of the Ambi Pur acquisition,
increased 5%. Mix negatively impacted net sales growth by 2% due
to disproportionate growth of mid-tier product lines and powdered
laundry detergents, which have lower than segment average selling
prices. Unfavorable foreign exchange reduced net sales by 1%. Volume
in developing regions was up high single digits, while volume in
developed regions grew mid-single digits. Fabric Care volume increased