Proctor and Gamble 2011 Annual Report Download - page 53
Download and view the complete annual report
Please find page 53 of the 2011 Proctor and Gamble annual report below. You can navigate through the pages in the report by either clicking on the pages listed below, or by using the keyword search tool below to find specific information within the annual report.-
 1
1 -
2
-
3
-
4
-
5
-
6
-
7
-
8
-
9
-
10
-
11
-
12
-
13
-
14
-
15
-
16
-
17
-
18
-
19
-
20
-
21
-
22
-
23
-
24
-
25
-
26
-
27
-
28
-
29
-
30
-
31
-
32
-
33
-
34
-
35
-
36
-
37
-
38
-
39
-
40
-
41
-
42
-
 43
43 -
 44
44 -
 45
45 -
 46
46 -
 47
47 -
 48
48 -
 49
49 -
 50
50 -
 51
51 -
 52
52 -
 53
53 -
 54
54 -
 55
55 -
 56
56 -
 57
57 -
 58
58 -
 59
59 -
 60
60 -
 61
61 -
 62
62 -
 63
63 -
64
-
65
-
66
-
67
-
68
-
69
-
70
-
71
-
72
-
73
-
74
-
75
-
76
-
77
-
78
-
79
-
80
-
81
-
82
 |
 |

Management’s Discussion and AnalysisThe Procter & Gamble Company 51
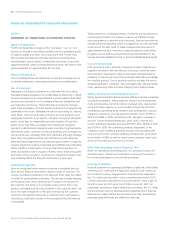
Measures Not Defined By U.S. GAAP
Our discussion of financial results includes several “non-GAAP” finan-
cial measures. We believe these measures provide our investors with
additional information about our underlying results and trends, as
well as insight to some of the metrics used to evaluate management.
When used in MD&A, we have provided the comparable GAAP
measure in the discussion. These measures include:
Organic Sales Growth. Organic sales growth is a non-GAAP measure
of sales growth excluding the impacts of acquisitions, divestitures and
foreign exchange from year-over-year comparisons. We believe this
provides investors with a more complete understanding of underlying
sales trends by providing sales growth on a consistent basis. Organic
sales is also one of the measures used to evaluate senior management
and is a factor in determining their at-risk compensation.
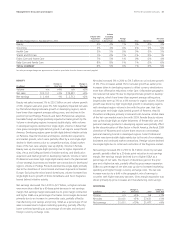
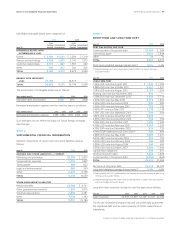
The following tables provide a numerical reconciliation of organic
sales growth to reported net sales growth:
Year ended June, 2011
NetSales
Growth
Foreign
Exchange
Impact
Acquisition
Divestiture
Impact
/
*
Organic
Sales
Growth
Beauty 3% -1%1% 3%
Grooming 5% 0% 0% 5%
Health Care5% 0% 0% 5%
Snacks and Pet Care1% -1%-5% -5%
Fabric Care and Home Care4% 1% -2% 3%
Baby Care and Family Care6% 1% 0% 7%
TOTAL P&G 5% 0% -1%4%
Year ended June30,2010
NetSales
Growth
Foreign
Exchange
Impact
Acquisition
Divestiture
Impact
/
*
Organic
Sales
Growth
Beauty 3% 0% 0% 3%
Grooming 3% 0% 0% 3%
Health Care2% 0% 0% 2%
Snacks and Pet Care1% -1%0% 0%
Fabric Care and Home Care3% 1% 0% 4%
Baby Care and Family Care4% 1% 0% 5%
TOTAL P&G 3% 1% -1%3%
* Acquisition/Divestiture Impact includes rounding impacts necessary to reconcile net sales to
organic sales.
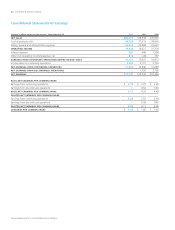
Core EPS. This is a measure of the Company’s diluted net earnings
per share from continuing operations excluding certain items that are
not judged to be part of the Company’s sustainable results or trends.
This includes a significant benefit in from the settlement of U.S. tax
litigation primarily related to the valuation of technology donations,
charges in both and related to pending European legal
matters, a charge related to a tax provision for retiree healthcare
subsidy payments in the U.S. healthcare reform legislation, and
incremental restructuring charges in 2009 to offset dilution caused by
the Folgers divestiture. We do not view these items to be part of our
sustainable results. We believe the Core EPS measure provides an
important perspective of underlying business trends and results and
provides a more comparable measure of year-on-year earnings per
share growth. Core EPS is also one of the measures used to evaluate
senior management and is a factor in determining their at-risk compen-
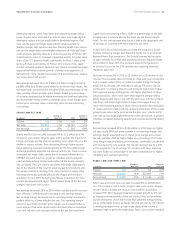
sation. The table below provides a reconciliation of reported diluted
net earnings per share from continuing operations to Core EPS:
Years ended June30 2011 2010 2009
Diluted Net Earnings Per Share—
Continuing Operations $3.93 $ 3.53 $ 3.39
Settlement from U.S. TaxLitigation (0.08)— —
Charges for Pending European
Legal Matters 0.10 0.09 —
Charge for Taxation of Retiree
Healthcare Subsidy —0.05 —
Incremental Folgers-related
Restructuring Charges—— 0.09
Rounding Impacts ——(0.01)
CORE EPS$3.95 $ 3.67 $ 3.47
Core EPS Growth 8% 6%
Note —All reconciling items are presented net of tax. Tax effects are calculated consistent with
the nature of the underlying transaction. The significant adjustment to an income tax reserve
was tax expense. There was no tax impact on EPS due to the charges for pending European
legal matters.
Free Cash Flow.Free cash flow is defined as operating cash flow less
capital spending. We view free cash flow as an important measure
because it is one factor in determining the amount of cash available
for dividends and discretionary investment. Free cash flow is also one
of the measures used to evaluate senior management and is a factor
in determining their at-risk compensation.
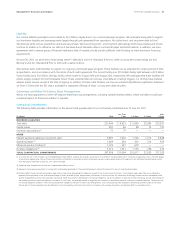
Free Cash Flow Productivity. Free cash flow productivity is defined as
the ratio of free cash flow to net earnings. Free cash flow productivity
is also one of the measures used to evaluate senior management and is
a factor in determining their at-risk compensation.
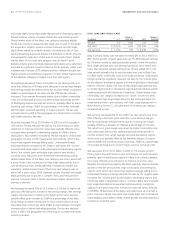
The following table provides a numerical reconciliation of free cash
flow and free cash flow productivity:
($ millions)
Operating
CashFlow
Capital
Spending
Free
CashFlow
Net
Earnings
Free
CashFlow
Productivity
2011 $13,231 $(3,306) $ 9,925 $11,797 84%
2010 16,072 (3,067)13,005 12,736 102%
2009 14,919 (3,238)11,681 13,436 87%