Proctor and Gamble 2011 Annual Report Download - page 2
Download and view the complete annual report
Please find page 2 of the 2011 Proctor and Gamble annual report below. You can navigate through the pages in the report by either clicking on the pages listed below, or by using the keyword search tool below to find specific information within the annual report.-
 1
1 -
 2
2 -
 3
3 -
 4
4 -
 5
5 -
 6
6 -
 7
7 -
 8
8 -
 9
9 -
 10
10 -
 11
11 -
 12
12 -
 13
13 -
14
-
15
-
16
-
17
-
18
-
19
-
20
-
21
-
22
-
23
-
24
-
25
-
26
-
27
-
28
-
29
-
30
-
31
-
32
-
33
-
34
-
35
-
36
-
37
-
38
-
39
-
40
-
41
-
42
-
43
-
44
-
45
-
46
-
47
-
48
-
49
-
50
-
51
-
52
-
53
-
54
-
55
-
56
-
57
-
58
-
59
-
60
-
61
-
62
-
63
-
64
-
65
-
66
-
67
-
68
-
69
-
70
-
71
-
72
-
73
-
74
-
75
-
76
-
77
-
78
-
79
-
80
-
81
-
82
 |
 |

$.
$.
$.
$.
$.
11
09
08
07
10
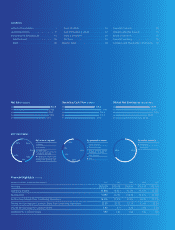
Net Sales ($ billions)
%
%
%
%
%
%
By business segment
Beauty
Grooming
Health Care
Snacks & Pet Care
Fabric Care & Home Care
Baby Care & Family Care
2011 Net Sales
9%
14%
16%
41%
20%
By geographic region
North America
Western Europe
Central & Eastern Europe,
Middle East & Africa
Latin America
Asia
% %
By market maturity
Developed
Developing
$13.2
$16.1
$14.9
$15.0
$13.4
11
09
08
07
10
Operating Cash Flow
($ billions)
$3.93
$4.11
$4.26
$3.64
$3.04
11
09
08
07
10
Diluted Net Earnings
(per common share)
Contents
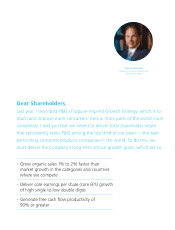
Letter to Shareholders.................................
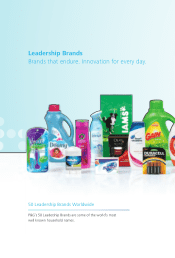
Leadership Brands.......................................
Innovating for Everyday Life......................
Gillette Guard ........................................
Brazil......................................................
Crest D White ......................................
Gain Dishwashing Liquid........................
Head & Shoulders ..................................
Old Spice ...............................................
Disaster Relief...........................................
Financial Contents ....................................
Global Leadership Council.........................
Board of Directors.....................................
Financial Summary....................................
Company and Shareholder Information.....
Financial Highlights (unaudited)
Amounts in millions, except per share amounts
Net Sales $, $, $, $, $,
Operating Income , , , , ,
Net Earnings , , , , ,
Net Earnings Margin from Continuing Operations .% .% .% .% .%
Diluted Net Earnings per Common Share from Continuing Operations $. $. $. $. $.
Diluted Net Earnings Per Common Share . . . . .
Dividends Per Common Share . . . . .