Proctor and Gamble 2011 Annual Report Download - page 63
Download and view the complete annual report
Please find page 63 of the 2011 Proctor and Gamble annual report below. You can navigate through the pages in the report by either clicking on the pages listed below, or by using the keyword search tool below to find specific information within the annual report.-
 1
1 -
2
-
3
-
4
-
5
-
6
-
7
-
8
-
9
-
10
-
11
-
12
-
13
-
14
-
15
-
16
-
17
-
18
-
19
-
20
-
21
-
22
-
23
-
24
-
25
-
26
-
27
-
28
-
29
-
30
-
31
-
32
-
33
-
34
-
35
-
36
-
37
-
38
-
39
-
40
-
41
-
42
-
43
-
44
-
45
-
46
-
47
-
48
-
49
-
50
-
51
-
52
-
 53
53 -
 54
54 -
 55
55 -
 56
56 -
 57
57 -
 58
58 -
 59
59 -
 60
60 -
 61
61 -
 62
62 -
 63
63 -
 64
64 -
 65
65 -
 66
66 -
 67
67 -
 68
68 -
 69
69 -
 70
70 -
 71
71 -
 72
72 -
 73
73 -
74
-
75
-
76
-
77
-
78
-
79
-
80
-
81
-
82
 |
 |

Notes to Consolidated Financial StatementsThe Procter & Gamble Company 61
Amounts in millions of dollars except per share amounts or as otherwise specified.
Commodity Risk Management
Certain raw materials used in our products or production processes are subject to price volatility caused by weather, supply conditions, political
and economic variables and other unpredictable factors. To manage the volatility related to anticipated purchases of certain of these materials, we
may, on a limited basis, use futures and options with maturities generally less than one year and swap contracts with maturities up to five years.
These market instruments generally are designated as cash flow hedges. The effective portion of the changes in fair value of these instruments
isreported in OCI and reclassified into earnings in the same financial statement line item and in the same period or periods during which the
hedged transactions affect earnings. The ineffective and non-qualifying portions, which are not material for any year presented, are immediately
recognized in earnings.
Insurance
We self-insure for most insurable risks. However, we purchase insurance for Directors and Officers Liability and certain other coverage in situations
where it is required by law, by contract or deemed to be in the best interest of the Company.
Fair Value Hierarchy
Accounting guidance on fair value measurements for certain financial assets and liabilities requires that financial assets and liabilities carried at
fair value be classified and disclosed in one of the following three categories:
Level1:Quoted market prices in active markets for identical assets orliabilities.
Level2:Observable market-based inputs or unobservable inputs thatare corroborated by market data.
Level3:Unobservable inputs reflecting the reporting entity’s own assumptions or external inputs from inactive markets.
When applying fair value principles in the valuation of assets and liabilities, we are required to maximize the use of quoted market prices and
minimize the use of unobservable inputs. We calculate the fair value of our Level 1and Level 2instruments based on the exchange traded price
of similar or identical instruments where available or based on other observable inputs. The fair value of our Level 3instruments is calculated as the
net present value of expected cash flows based on externally provided or obtained inputs. Certain Level 3assets may also be based on sales prices
of similar assets. Our fair value calculations take into consideration the credit risk of both the Company and our counterparties. The Company has
not changed its valuation techniques used in measuring the fair value of any financial assets and liabilities during the year.
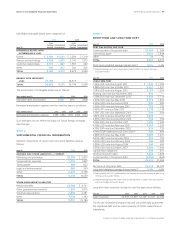
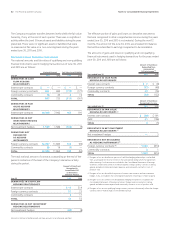
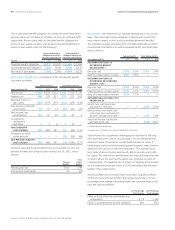
The following table sets forth the Company’s financial assets and liabilities as of June30,2011 and 2010 that were measured at fair value on a
recurring basis during the period, segregated by level within the fair value hierarchy:
Level 1Level Level Total
June30 2010 2010 2010 2010
ASSETS AT FAIR VALUE:
Investment securities $16 $12 $ — $— $23 $45 $39 $57
Derivatives relating to:
Foreign currency hedges ——1———1—
Other foreign currency instruments(1)——182 81 ——182 81
Interest rates——163 191 ——163 191
Net investment hedges ———14 ———14
Commodities ——410 ——410
TOTAL ASSETS AT FAIR VALUE(2)16 12 350 296 23 45 389 353
LIABILITIES AT FAIR VALUE:
Derivatives relating to:
Foreign currency hedges ——119 177 ——119 177
Other foreign currency instruments(1)——43 175 ——43 175
Net investment hedges ——138 23 ——138 23
Commodities ——1———1—
TOTAL LIABILITIES AT FAIR VALUE (3)——301 375 ——301 375
(1) Other foreign currency instruments are comprised of foreign currency financial instruments that do not qualify as hedges.
(2) Investment securities are presented in other noncurrent assets and all derivative assets are presented in prepaid expenses and other current assets or other noncurrent assets.
(3) All liabilities are presented in accrued and other liabilities or other noncurrent liabilities.