Proctor and Gamble 2011 Annual Report Download - page 39
Download and view the complete annual report
Please find page 39 of the 2011 Proctor and Gamble annual report below. You can navigate through the pages in the report by either clicking on the pages listed below, or by using the keyword search tool below to find specific information within the annual report.-
 1
1 -
2
-
3
-
4
-
5
-
6
-
7
-
8
-
9
-
10
-
11
-
12
-
13
-
14
-
15
-
16
-
17
-
18
-
19
-
20
-
21
-
22
-
23
-
24
-
25
-
26
-
27
-
28
-
 29
29 -
 30
30 -
 31
31 -
 32
32 -
 33
33 -
 34
34 -
 35
35 -
 36
36 -
 37
37 -
 38
38 -
 39
39 -
 40
40 -
 41
41 -
 42
42 -
 43
43 -
 44
44 -
 45
45 -
 46
46 -
 47
47 -
 48
48 -
 49
49 -
50
-
51
-
52
-
53
-
54
-
55
-
56
-
57
-
58
-
59
-
60
-
61
-
62
-
63
-
64
-
65
-
66
-
67
-
68
-
69
-
70
-
71
-
72
-
73
-
74
-
75
-
76
-
77
-
78
-
79
-
80
-
81
-
82
 |
 |

Management’s Discussion and AnalysisThe Procter & Gamble Company 37
of credit markets. Such events could negatively impact our ability to
collect receipts due from governments, including refunds of value
added taxes, create significant credit risks relative to our local custom-
ers and depository institutions, and/or negatively impact our overall
liquidity.
Regulatory Environment.Changes in laws, regulations and the related
interpretations may alter the environment in which we do business.
This includes changes in environmental, competitive and product-
related laws, as well as changes in accounting standards and taxation
requirements. Our ability to manage regulatory, tax and legalmatters
(including product liability, patent, intellectual property, competition
law matters and tax policy) and to resolve pending legal matters within
current estimates may impact our results.
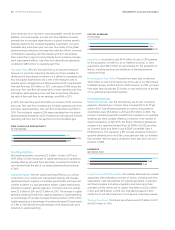
RESULTS OF OPERATIONS
Net Sales
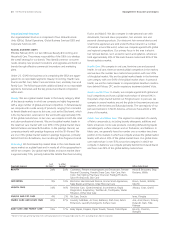
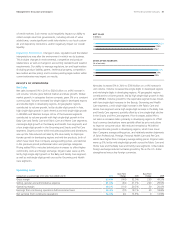
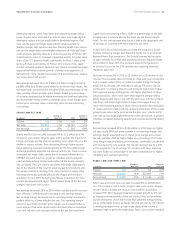
Net sales increased 5% in 2011 to $82.6billion on a 6% increase in
unit volume. Volume grew behind market and share growth. Global
market growth, in categories that we compete, grew 3% on a constant
currency basis. Volume increased low single digits in developed regions
and double digits in developing regions. All geographic regions
contributed to volume growth, led by double-digit growth in Asia,
high single-digit growth in Latin America and mid-single-digit growth
in CEEMEA and Western Europe. All six of the business segments
contributed to volume growth with high single-digit growth in the
Baby Care and Family Care and Fabric Care and Home Care segments,
mid-single-digit growth in the Beauty and Health Care segments, and
a low single-digit growth in the Grooming and Snacks and Pet Care
segments. Organic volume, which excludes acquisitions and divestitures,
was up 5%. Mix reduced net sales by 2% due mainly to dispropor-
tionate growth in developing regions and mid-tier products, both of
which have lower than Company average selling prices, and declines
in the premium-priced professional salon and prestige categories.
Pricing added 1% to net sales behind price increases to offset higher
commodity costs and foreign exchange. Organic sales were up 4%,
led by high single-digit growth in the Baby and Family Care segment,
as well as mid-single-digit growth across the Grooming and Health
Care segments.
$.
$.
$.
11
09
10
NET SALES
($ billions)
%
35%
%
11
09
10
DEVELOPING MARKETS
(% of net sales)
Net sales increased 3% in 2010 to $78.9billion on a 4% increase in
unit volume. Volume increased low single digits in developed regions
and mid-single digits in developing regions. All geographic regions
contributed to volume growth, led by high single-digit growth in Asia
and CEEMEA. Volume growth for the reportable segments was mixed,
with low single-digit increases in the Beauty, Grooming and Health
Care segments, a mid-single-digit increase in the Fabric Care and
Home Care segment and a high single-digit increase in the Baby Care
and Family Care segment, partially offset by a low single-digit decline
in the Snacks and Pet Care segment. Price increases added 1% to
netsales as increases taken primarily in developing regions to offset
local currency devaluations were partially offset by price reductions
toimprove consumer value. Mix reduced net sales by 1% behind
disproportionate growth in developing regions, which have lower
than Company average selling prices, and relatively weaker shipments
of Salon Professional, Prestige, Personal Health Care and Pet Care,
which have higher than Company average selling prices. Organic sales
were up 3%, led by mid-single-digit growth across the Fabric Care and
Home Care and the Baby Care and Family Care segments. Unfavorable
foreign exchange reduced net sales growth by 1% as the U.S. dollar
strengthened versus key foreign currencies.
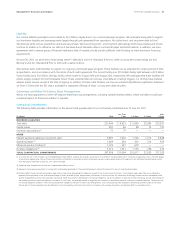
Operating Costs
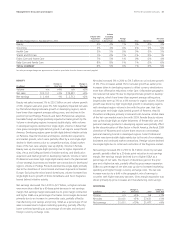
Comparisons as a percentage of net sales; Years ended June30 2011
BasisPoint
Change 2010
BasisPoint
Change 2009
Gross margin 50.6% (140)52.0% 250 49.5%
Selling, general and administrative expense 31.4% (30)31.7% 220 29.5%
Operating margin 19.2% (110)20.3% 30 20.0%
Earnings from continuing operations before income taxes 18.4% (70)19.1% 30 18.8%
Net earnings from continuing operations 14.3% 40 13.9% 013.9%