Proctor and Gamble 2011 Annual Report Download - page 47
Download and view the complete annual report
Please find page 47 of the 2011 Proctor and Gamble annual report below. You can navigate through the pages in the report by either clicking on the pages listed below, or by using the keyword search tool below to find specific information within the annual report.-
 1
1 -
2
-
3
-
4
-
5
-
6
-
7
-
8
-
9
-
10
-
11
-
12
-
13
-
14
-
15
-
16
-
17
-
18
-
19
-
20
-
21
-
22
-
23
-
24
-
25
-
26
-
27
-
28
-
29
-
30
-
31
-
32
-
33
-
34
-
35
-
36
-
 37
37 -
 38
38 -
 39
39 -
 40
40 -
 41
41 -
 42
42 -
 43
43 -
 44
44 -
 45
45 -
 46
46 -
 47
47 -
 48
48 -
 49
49 -
 50
50 -
 51
51 -
 52
52 -
 53
53 -
 54
54 -
 55
55 -
 56
56 -
 57
57 -
58
-
59
-
60
-
61
-
62
-
63
-
64
-
65
-
66
-
67
-
68
-
69
-
70
-
71
-
72
-
73
-
74
-
75
-
76
-
77
-
78
-
79
-
80
-
81
-
82
 |
 |
Management’s Discussion and AnalysisThe Procter & Gamble Company 45
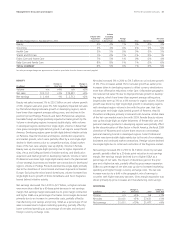
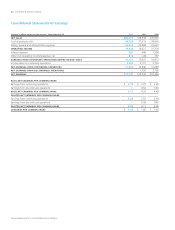
Net earnings increased % to $.billion in behind net sales
growth and basis points of net earnings margin expansion driven
by higher gross margin, partially offset by higher SG&A as a percentage
of net sales. Gross margin increased mainly due to lower commodity
costs and manufacturing cost savings. SG&A as a percentage of net
sales increased primarily behind incremental marketing investments
and higher foreign currency exchange costs.
Corporate
Corporate includes certain operating and non-operating activities not
allocated to specific business units. These include: the incidental
businesses managed at the corporate level; financing and investing
activities; other general corporate items; the historical results of certain
divested brands and categories; and certain restructuring-type activities
to maintain a competitive cost structure, including manufacturing
and workforce optimization. Corporate also includes reconciling items
to adjust the accounting policies used in the segments to U.S. GAAP.
The most significant reconciling items include income taxes (to adjust
from statutory rates that are reflected in the segments to the overall
Company effective tax rate), adjustments for unconsolidated entities
(to eliminate net sales, cost of products sold and SG&A for entities
that are consolidated in the segments but accounted for using the
equity method for U.S. GAAP) and noncontrolling interest adjustments
for subsidiaries where we do not have % ownership. Since certain
unconsolidated entities and less than%-owned subsidiaries are
managed as integral parts of the Company, they are accounted for
similar to a wholly-owned subsidiary for management and segment
purposes. This means our segment results recognize % of each
income statement component through before-tax earnings in the
segments, with eliminations for unconsolidated entities and noncon-
trolling interests in Corporate. In determining segment net earnings,
we apply the statutory tax rates (with adjustments to arrive at the
Company’s effective tax rate in Corporate) and eliminate the share of
earnings applicable to other ownership interests, in a manner similar
to noncontrolling interest.
Corporate net sales primarily reflect the adjustment to eliminate the
sales of unconsolidated entities included in business segment results.
Accordingly, Corporate net sales are generally a negative balance. In
, negative net sales in Corporate were down $98 million due to
adjustments required to eliminate sales of unconsolidated entities.
Net income from continuing operations increased $1.3billion to
$456million. The increase was due to current-period net discrete
adjustments to reverse reserves for uncertain tax positions, prior-period
charges for the taxation of certain future retiree prescription drug
subsidy payments in the U.S., lower current-period interest expense,
areduction in restructuring-type charges, and current-year divestiture
gains. Additional discussion of the items impacting net income in
Corporate are included in the Results of Operations section.
In 2010, negative net sales in Corporate were up 2% mainly due to
adjustments required to eliminate sales of unconsolidated entities.
Net expenses from continuing operations increased $603 million to
$817 million. The increase was primarily due to 2010 charges for
competition law fines and for enacted legislation impacting the
taxation of certain future retiree prescription drug subsidy payments
in the U.S. and the impact of higher prior-period divestiture gains and
tax audit settlements. These impacts were partially offset by lower
interest expense and restructuring charges in 2010.
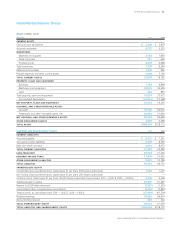
FINANCIAL CONDITION
We believe our financial condition continues to be of high quality, as
evidenced by our ability to generate substantial cash from operations
and ready access to capital markets at competitive rates.
Operating cash flow provides the primary source of funds to finance
operating needs and capital expenditures. Excess operating cash is
used first to fund shareholder dividends. Other discretionary uses
include share repurchases and tack-on acquisitions to complement
our portfolio of brands and geographies. As necessary, we may
supplement operating cash flow with debt to fund these activities.
The overall cash position of the Company reflects our strong business
results and a global cash management strategy that takes into account
liquidity management, economic factors and tax considerations.
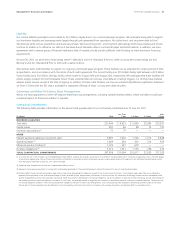
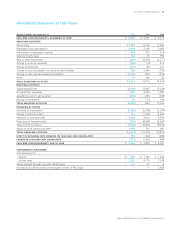
Operating Activities
Operating cash flow was $13.2billion in 2011, an 18% decrease versus
the prior year. Operating cash flow resulted primarily from net earnings
adjusted for non-cash items (depreciation and amortization, stock-
based compensation, deferred income taxes and gain on the sale of
businesses), partially offset by an increase in working capital. The net
of accounts receivable, inventory and accounts payable consumed
$569 million of operating cash flow in 2011 mainly due to increases in
inventories and accounts receivables. Inventory consumed $501 million
driven by higher commodity costs, business growth and increased
stock levels in advance of initiatives and sourcing changes. Inventory
days on hand increased by five days due to the impact of foreign
exchange, higher commodity costs and increased safety stock levels.
Accounts receivable used $426 million primarily to support business
growth. Accounts receivable days sales outstanding were up three
days due to timing of sales and the impact of foreign exchange.
Inventory and accounts receivable increases were partially offset by
accounts payable, accrued and other liabilities, which increased to
support business growth. Other operating assets and liabilities were
also a significant use of operating cash flow due primarily to net
reductions in reserves for uncertain tax positions and an increase in
the amount of value added taxes due from various governmental
authorities. In the prior year, working capital was a net source of cash.
Operating cash flow was $16.1billion in 2010, an 8% increase versus
the prior year. Operating cash flow resulted primarily from net earn-
ings adjusted for non-cash items (depreciation and amortization,
stock-based compensation, deferred income taxes and gain on the
sale of businesses) and a reduction in working capital. The increase in
operating cash flow versus2009 was primarily due to the 2010
reduction in working capital balances, partially offset by a decline in
earnings versus 2009. The net of accounts receivable, inventory, and
accounts payable contributed $2.5billion to operating cash flow in