Proctor and Gamble 2003 Annual Report Download - page 52
Download and view the complete annual report
Please find page 52 of the 2003 Proctor and Gamble annual report below. You can navigate through the pages in the report by either clicking on the pages listed below, or by using the keyword search tool below to find specific information within the annual report.-
 1
1 -
2
-
3
-
4
-
5
-
6
-
7
-
8
-
9
-
10
-
11
-
12
-
13
-
14
-
15
-
16
-
17
-
18
-
19
-
20
-
21
-
22
-
23
-
24
-
25
-
26
-
27
-
28
-
29
-
30
-
31
-
32
-
33
-
34
-
35
-
36
-
37
-
38
-
39
-
40
-
41
-
 42
42 -
 43
43 -
 44
44 -
 45
45 -
 46
46 -
 47
47 -
 48
48 -
 49
49 -
 50
50 -
 51
51 -
 52
52 -
 53
53 -
 54
54 -
 55
55 -
 56
56 -
 57
57 -
 58
58 -
 59
59 -
 60
60
 |
 |

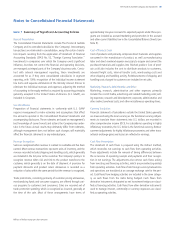
50Notes to Consolidated Financial Statements The Procter & Gamble Company and Subsidiaries
plan assets were comprised of Company stock, net of Series B ESOP
debt (see Note 6), of $2,182 and $2,243, as of June 30, 2003 and
2002, respectively.
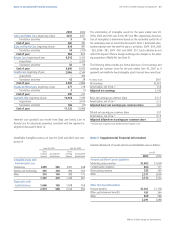
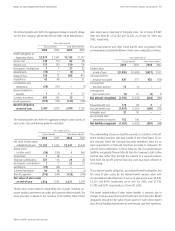
The accrued pension and other retiree benefit costs recognized in the
accompanying Consolidated Balance Sheets were computed as follows:
The underfunding of pension benefits primarily is a function of the dif-
ferent funding incentives that exist outside of the United States. In cer-
tain countries where the Company has major operations, there are no
legal requirements or financial incentives provided to companies for
pension fund contributions. In these instances, the associated pension
liabilities are typically financed directly from the Company’s cash as they
become due, rather than through the creation of a separate pension
fund. Both the benefit and the financing costs have been reflected in
net earnings.
The projected benefit obligation, accumulated benefit obligation and
fair value of plan assets for the defined benefit pension plans with
accumulated benefit obligations in excess of plan assets were $2,945,
$2,310 and $979, respectively, as of June 30, 2003, and $1,718,
$1,385 and $276, respectively, as of June 30, 2002.
The recent underfunding of other retiree benefits is primarily due to
changes in the assumed discount and health care cost trend rates. Benefit
obligations exceed the fair value of plan assets for each retiree benefit
plan. Annual funding requirements are met through cash from operations.
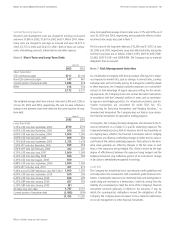
The following table sets forth the aggregate change in benefit obliga-
tion for the Company’s defined benefit and other retiree benefit plans:
The following table sets forth the aggregate change in plan assets, as
well as the cash contributions made for each plan:
Pension plan assets comprise a diversified mix of assets including cor-
porate equities, government securities and corporate debt securities. The
asset allocation is based on the structure of the liability. Other retiree
Millions of dollars except per share amounts
2003 2002
$2,970 $2,567
124 114
173 153
7 7
(33) 1
138 72
42 40
(29) (101)
1 9
305 255
(155) (147)
3,543 2,970
Benefit obligation at
beginning of year
Service cost
Interest cost
Participants’ contributions
Amendments
Actuarial loss
Acquisitions
Curtailments and
settlements
Special termination
benefits
Currency translation
Benefit payments
Benefit obligation
at end of year
2003 2002
$2,135 $1,577
62 49
150 116
27 22
(2) 5
645 401
– 32
– (1)
7 37
13 5
(123) (108)
2,914 2,135
Years ended June 30
Pension Benefits Other Retiree Benefits
2002
$1,432
(150)
18
116
7
(22)
78
(147)
1,332
Fair value of plan assets
at beginning of year
Actual return
on plan assets
Acquisitions
Employer contributions
Participants’ contributions
Settlements
Currency translation
Benefit payments
Fair value of plan assets
at end of year
Years ended June 30
2003
$1,332
(36)
1
337
7
(27)
99
(155)
1,558
2002
$1,449
947
–
38
22
–
(1)
(108)
2,347
2003
$2,347
1
–
25
27
–
–
(123)
2,277
Pension Benefits Other Retiree Benefits
2002
$(1,638)
571
14
21
(1,032)
94
(1,250)
18
106
(1,032)
Funded status
at end of year
Unrecognized net
actuarial loss (gain)
Unrecognized
transition amount
Unrecognized
prior service cost
Net amount recognized
Prepaid benefit cost
Accrued benefit cost
Intangible asset
Accumulated other
comprehensive income
Net liability recognized
2003
$(1,985)
930
13
(9)
(1,051)
173
(1,407)
31
152
(1,051)
2002
$212
(579)
–
(1)
(368)
2
(370)
–
–
(368)
2003
$(637)
435
–
(2)
(204)
2
(206)
–
–
(204)
Years ended June 30
Pension Benefits Other Retiree Benefits