Proctor and Gamble 2003 Annual Report Download - page 34
Download and view the complete annual report
Please find page 34 of the 2003 Proctor and Gamble annual report below. You can navigate through the pages in the report by either clicking on the pages listed below, or by using the keyword search tool below to find specific information within the annual report.-
 1
1 -
2
-
3
-
4
-
5
-
6
-
7
-
8
-
9
-
10
-
11
-
12
-
13
-
14
-
15
-
16
-
17
-
18
-
19
-
20
-
21
-
22
-
23
-
 24
24 -
 25
25 -
 26
26 -
 27
27 -
 28
28 -
 29
29 -
 30
30 -
 31
31 -
 32
32 -
 33
33 -
 34
34 -
 35
35 -
 36
36 -
 37
37 -
 38
38 -
 39
39 -
 40
40 -
 41
41 -
 42
42 -
 43
43 -
 44
44 -
45
-
46
-
47
-
48
-
49
-
50
-
51
-
52
-
53
-
54
-
55
-
56
-
57
-
58
-
59
-
60
 |
 |

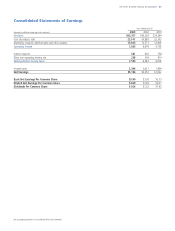
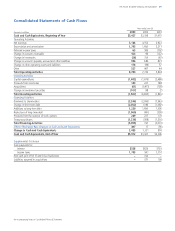
32Financial Review The Procter & Gamble Company and Subsidiaries
Asset write-downs relate to establishment of new fair-value bases for
assets held for sale or disposal and for assets whose future cash flow
expectations have declined significantly as a direct result of restructur-
ing decisions. Assets held for sale or disposal represent excess capacity
that is in the process of being removed from service as well as busi-
nesses held for sale within the next 12 months. Such assets are written
down to the net amount expected to be realized upon sale or disposal.
Assets continuing in operation, but whose nominal cash flows are no
longer sufficient to recover existing book values, are written down to
estimated fair value, generally determined by reference to the discount-
ed expected future cash flows. Write-downs of assets that will continue
to be used were approximately $60 million before tax ($40 million after
tax) in 2003, $45 million before tax ($33 million after tax) in 2002 and
$160 million before tax ($133 million after tax) in 2001. Asset write-
downs are not expected to significantly impact future annual deprecia-
tion expense.
Other contains charges incurred as a direct result of restructuring deci-
sions including relocation, training, discontinuation of initiatives and the
establishment of global business services and the new legal and organ-
ization structure. These costs are charged to the applicable income
statement line item based on the underlying nature of the charge.
Restructuring accruals are classified as current liabilities. Reserve balan-
ces were $335 million, $245 million and $460 million at June 30, 2003,
2002 and 2001, respectively. Approximately 60% of restructuring
charges incurred during 2003 are expected to be settled with cash,
compared to 60% in 2002 and 40% in 2001.
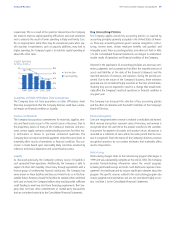
Savings from the restructuring program are difficult to estimate, given
the nature of the activities, the corollary benefits achieved, timing and
the degree of reinvestment. Overall, the program is expected to deliver
nearly $1.65 billion in after-tax annual savings, including additional af-
ter-tax savings of approximately $200 million in 2004 as a result of
charges incurred in the current year. Estimated after-tax incremental
savings delivered were $450 million in 2003, $700 million in 2002,
$235 million in 2001 and $65 million in 2000.
While the total charges and incremental savings for the program are
less than previous estimates, the ratio of savings to charges is in line
with the original expectations.
The program was substantially complete at the end of 2003. Cumulative
charges through June 30, 2003 totaled $4.85 billion before tax ($3.79
billion after tax), below the initial estimate of $5.60 billion before tax
($4.40 billion after tax). Because the program is substantially complete,
the Company intends to discontinue separate reporting of the program
in future periods. The Company will continue to undertake projects to
maintain a competitive cost structure, including manufacturing consoli-
dation and work force rationalization, as a part of its normal operations.
Separations represent the cost of packages offered to employees, which
generally are accrued upon employee acceptance. The separation pack-
ages are predominantly voluntary and are formula driven based on sal-
ary levels and past service. Separation costs are charged to cost of
products sold for manufacturing employees and marketing, research,
administrative and other expense for all other employees.
Approximately 21,600 separation packages have been provided for
through June 30, 2003: 5,000 in 2003, 7,400 in 2002, 6,000 in 2001
and 3,200 from 1999 to 2000. While all geographies and businesses
are impacted by the enrollment reduction programs, a higher number of
United States employees are affected, given the concentration of oper-
ations. The changes in the net enrollment for the Company are different
from the total separations, as terminations have been offset by
increased enrollment at remaining sites, acquisitions and other impacts.
Accelerated depreciation relates to long-lived assets that will be taken
out of service prior to the end of their normal service period due to
manufacturing consolidations, technology standardization, plant clo-
sures or strategic choices to discontinue initiatives. The Company has
shortened the estimated useful lives of such assets, resulting in incre-
mental depreciation expense. For segment and management reporting
purposes, normal depreciation expense is reported by the business seg-
ments, with the incremental accelerated depreciation reported in Cor-
porate. Accelerated depreciation is charged to cost of products sold for
manufacturing assets and marketing, research, administrative and oth-
er expense for all other assets.
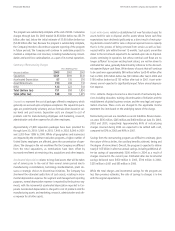
2001
$341
276
731
502
1,850
1,475
2003
$351
87
190
123
751
538
Separations
Accelerated Depreciation
Asset Write-Downs
Other
Total (before tax)
Total (after tax)
2002
$393
135
208
222
958
706
Years ended June 30
Amounts in millions
Summary of Restructuring Charges