Proctor and Gamble 2003 Annual Report Download - page 48
Download and view the complete annual report
Please find page 48 of the 2003 Proctor and Gamble annual report below. You can navigate through the pages in the report by either clicking on the pages listed below, or by using the keyword search tool below to find specific information within the annual report.-
 1
1 -
2
-
3
-
4
-
5
-
6
-
7
-
8
-
9
-
10
-
11
-
12
-
13
-
14
-
15
-
16
-
17
-
18
-
19
-
20
-
21
-
22
-
23
-
24
-
25
-
26
-
27
-
28
-
29
-
30
-
31
-
32
-
33
-
34
-
35
-
36
-
37
-
 38
38 -
 39
39 -
 40
40 -
 41
41 -
 42
42 -
 43
43 -
 44
44 -
 45
45 -
 46
46 -
 47
47 -
 48
48 -
 49
49 -
 50
50 -
 51
51 -
 52
52 -
 53
53 -
 54
54 -
 55
55 -
 56
56 -
 57
57 -
 58
58 -
59
-
60
 |
 |

Notes to Consolidated Financial Statements 46The Procter & Gamble Company and Subsidiaries
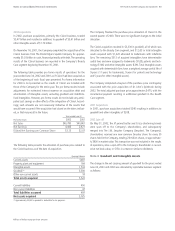
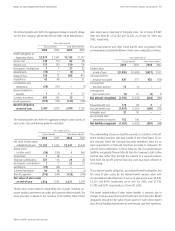
Long-term weighted average interest rates were 3.7% and 4.0% as of
June 30, 2003 and 2002, respectively, and included the effects of relat-
ed interest rate swaps discussed in Note 7.
The fair value of the long-term debt was $12,396 and $11,673 at June
30, 2003 and 2002, respectively. Long-term debt maturities during the
next five fiscal years are as follows: 2004-$1,093; 2005-$1,495; 2006-
$2,463; 2007-$1,091 and 2008-$804. The Company has no material
obligations that are secured.
Note 7 Risk Management Activities
As a multinational company with diverse product offerings, the Compa-
ny is exposed to market risks, such as changes in interest rates, currency
exchange rates and commodity pricing. To manage the volatility related
to these exposures, the Company evaluates exposures on a consolidat-
ed basis to take advantage of logical exposure netting. For the remain-
ing exposures, the Company enters into various derivative transactions
in accordance with the Company’s policies in areas such as counterpar-
ty exposure and hedging practices. For all periods presented, such de-
rivative transactions are accounted for under SFAS No. 133,
“Accounting for Derivative Instruments and Hedging Activities,” as
amended and interpreted. The Company does not hold or issue deriva-
tive financial instruments for speculative trading purposes.
At inception, the Company formally designates and documents the fi-
nancial instrument as a hedge of a specific underlying exposure. The
Company formally assesses, both at inception and at least quarterly on
an ongoing basis, whether the financial instruments used in hedging
transactions are effective at offsetting changes in either the fair value or
cash flows of the related underlying exposure. Fluctuations in the deriv-
ative value generally are offset by changes in the fair value or cash
flows of the exposures being hedged. This offset is driven by the high
degree of effectiveness between the exposure being hedged and the
hedging instrument. Any ineffective portion of an instrument’s change
in fair value is immediately recognized in earnings.
Credit Risk
The Company has established strict counterparty credit guidelines and
normally enters into transactions with investment grade financial insti-
tutions. Counterparty exposures are monitored daily and downgrades in
credit rating are reviewed on a timely basis. Credit risk arising from the
inability of a counterparty to meet the terms of the Company’s financial
instrument contracts generally is limited to the amounts, if any, by
which the counterparty’s obligations exceed the obligations of the
Company. The Company does not expect to incur material credit losses
on its risk management or other financial instruments.
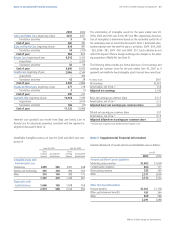
Selected Operating Expenses
Research and development costs are charged to earnings as incurred
and were $1,665 in 2003, $1,601 in 2002 and $1,769 in 2001. Adver-
tising costs are charged to earnings as incurred and were $4,373 in
2003, $3,773 in 2002 and $3,612 in 2001. Both of these are compo-
nents of marketing, research, administrative and other expense.
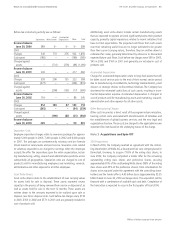
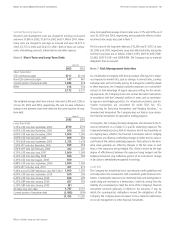
Note 6 Short-Term and Long-Term Debt
The weighted average short-term interest rates were 3.6% and 2.9% as
of June 30, 2003 and 2002, respectively. The rate increase reflected a
change in mix between short-term debt and the current portion of long-
term debt.
Millions of dollars except per share amounts
2002
$2,142
461
618
510
3,731
Short-Term Debt
USD commercial paper
Non-USD commercial paper
Current portion of long-term debt
Other
2003
$717
147
1,093
215
2,172
June 30
2002
$750
200
1,000
400
1,478
459
201
1,000
500
–
1,000
417
1,000
200
300
763
–
2,151
(618)
11,201
Long-Term Debt
5.25% USD note due September, 2003
8.00% USD note due November, 2003
6.60% USD note due December, 2004
4.00% USD note due April, 2005
5.75% EUR note due September, 2005
1.50% JPY note due December, 2005
3.50% CHF note due February, 2006
4.75% USD note due June, 2007
6.13% USD note due May, 2008
4.30% USD note due August, 2008
6.88% USD note due September, 2009
2.00% JPY note due June, 2010
9.36% Series B ESOP debentures due 2007-2021
8.00% USD note due September, 2024
6.45% USD note due January, 2026
6.25% GBP note due January, 2030
5.25% GBP note due January, 2033
All other long-term debt
Current portion of long-term debt
2003
$750
200
1,000
400
1,725
459
222
1,000
500
500
1,000
417
1,000
200
300
827
331
1,737
(1,093)
11,475
June 30