Proctor and Gamble 2003 Annual Report Download - page 29
Download and view the complete annual report
Please find page 29 of the 2003 Proctor and Gamble annual report below. You can navigate through the pages in the report by either clicking on the pages listed below, or by using the keyword search tool below to find specific information within the annual report.-
 1
1 -
2
-
3
-
4
-
5
-
6
-
7
-
8
-
9
-
10
-
11
-
12
-
13
-
14
-
15
-
16
-
17
-
18
-
 19
19 -
 20
20 -
 21
21 -
 22
22 -
 23
23 -
 24
24 -
 25
25 -
 26
26 -
 27
27 -
 28
28 -
 29
29 -
 30
30 -
 31
31 -
 32
32 -
 33
33 -
 34
34 -
 35
35 -
 36
36 -
 37
37 -
 38
38 -
 39
39 -
40
-
41
-
42
-
43
-
44
-
45
-
46
-
47
-
48
-
49
-
50
-
51
-
52
-
53
-
54
-
55
-
56
-
57
-
58
-
59
-
60
 |
 |
Financial Review 27The Procter & Gamble Company and Subsidiaries
In July 2003, the Company announced it was exploring strategic alter-
natives with respect to the global juice business, which could include
the sale of its brands and related assets. The impacts of any potential
sale of this business are not currently determinable. While clearly a
significant portion of Snacks and Beverages, the ongoing impacts of a
potential divestiture are not expected to be material to the Company’s
operations or financial condition.
Corporate
Corporate includes certain operating and non-operating activities as
well as eliminations to adjust management reporting principles to U.S.
GAAP. Operating activities in Corporate include the results of incidental
businesses managed at the corporate level along with the elimination
of individual line item results for companies over which the Company
exerts significant influence, but does not control the operations. Oper-
ating elements also include intangible asset amortization charges,
restructuring program charges, certain employee benefit costs and
other general corporate items. The non-operating elements include
financing and investing activities. In addition, Corporate includes the
historical results of certain divested businesses of the former Food and
Beverage segment.
Corporate net sales in 2003 primarily reflected the elimination of sales
by companies over which the Company exerts significant influence, but
does not control. Sales in 2002 included these eliminations along with
net sales of the divested businesses of the former Food and Beverage
segment. Lower Corporate earnings in 2003 primarily reflected the
impact of the Jif and Crisco operations in the base period. Corporate
earnings were also lower due to financing elements of employee bene-
fit plans and hedging impacts from a stronger Euro, partially offset by
decreased restructuring costs.
In 2002, Corporate earnings reflected lower restructuring costs, lower
interest expense and the discontinuation of amortization of goodwill
and indefinite-lived intangibles. These were partially offset by reduced
gains from hedging.
negative mix impact of 2%. The negative product mix impact was
primarily driven by growth in developing regions and a shift in Actonel
volume mix, which is sold under an alliance agreement, to support the
global Once-a-week dosage launch. Under the agreement, the sales
rate differs based upon geography.
Net earnings for Health Care were $706 million, an increase of 35%.
The majority of the increase was driven by volume growth and the shift
to higher margin products, partially offset by additional marketing
investments to support product initiatives, including Actonel, Crest
Whitestrips and Crest Night Effects.
In 2002, Health Care delivered a 15% increase in unit volume, driven
by growth in the oral care and pharmaceutical businesses. Net sales
increased 14% to $4.98 billion, including a 1% negative impact of for-
eign exchange. Health Care’s volume growth from high-margin prod-
ucts funded increased marketing investments while still delivering a net
earnings increase of 34% to $521 million.
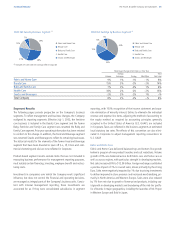
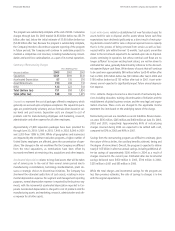
Snacks and Beverages
Snacks and Beverages unit volume declined 2% reflecting the impact of
the business interruption on snacks shipments caused by tornado dam-
age to the Jackson, Tennessee manufacturing facility, as well as softness
in the juice category. Net sales were $3.24 billion, or essentially flat
versus the prior year, as a positive 3% impact from foreign exchange
and 1% from mix were partially offset by a negative 2% impact from
pricing, primarily driven by price declines in the coffee category in
response to increased competitive promotional spending. Despite the
impact of the tornado and lower volume, net earnings increased 1% to
$306 million, driven by reductions in cost of products sold, reflecting
the impact of both base business and restructuring savings.
In 2002, Snacks and Beverages delivered earnings growth despite
top-line challenges. Unit volume declined 2% and sales declined 6%
to $3.25 billion driven by commodity-related pricing actions in coffee
and negative foreign exchange impacts. Net earnings grew 25%, to
$303 million, as broad-based cost reductions more than offset declin-
ing volumes.