Proctor and Gamble 2003 Annual Report Download - page 30
Download and view the complete annual report
Please find page 30 of the 2003 Proctor and Gamble annual report below. You can navigate through the pages in the report by either clicking on the pages listed below, or by using the keyword search tool below to find specific information within the annual report.-
 1
1 -
2
-
3
-
4
-
5
-
6
-
7
-
8
-
9
-
10
-
11
-
12
-
13
-
14
-
15
-
16
-
17
-
18
-
19
-
 20
20 -
 21
21 -
 22
22 -
 23
23 -
 24
24 -
 25
25 -
 26
26 -
 27
27 -
 28
28 -
 29
29 -
 30
30 -
 31
31 -
 32
32 -
 33
33 -
 34
34 -
 35
35 -
 36
36 -
 37
37 -
 38
38 -
 39
39 -
 40
40 -
41
-
42
-
43
-
44
-
45
-
46
-
47
-
48
-
49
-
50
-
51
-
52
-
53
-
54
-
55
-
56
-
57
-
58
-
59
-
60
 |
 |
28
Financial Review The Procter & Gamble Company and Subsidiaries
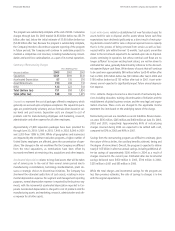
Proceeds from the divestiture of certain non-strategic brands and other
asset sales generated $143 million in cash flow in the current year,
compared to $227 million generated in 2002. Divestitures in both years
reflect historical levels, but represent a significant decline when com-
pared to the $788 million generated in 2001 during the Company’s
program to divest minor brands.
The Company maintains a share repurchase program, which authorizes
the purchase of shares of Company stock annually on the open market.
A primary purpose of the program is to mitigate the dilutive impact of
stock option grants, effectively prefunding the exercise obligation. Addi-
tionally, there is a discretionary component under which the Company
may repurchase additional outstanding shares. Current year purchases
under the combined programs were $1.24 billion, reflecting a return
to historical levels, compared to $568 million in 2002 and $1.25 billion
in 2001. The decline in 2002 was primarily due to cash requirements
associated with the Clairol acquisition.
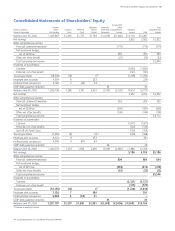
Common share dividends grew 8% to $1.64 per share in 2003 versus
$1.52 in 2002 and $1.40 in 2001. The annual dividend rate will
increase 11% to $1.82 per common share in 2004, marking the 48th
consecutive fiscal year of increased common share dividend payments.
Total dividend payments, to both common and preferred shareholders,
were $2.25 billion, $2.10 billion and $1.94 billion in 2003, 2002 and
2001, respectively.
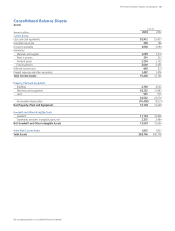
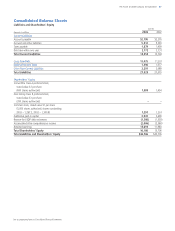
Total debt decreased from $14.93 billion in 2002 to $13.65 billion in
2003, a reduction of $1.28 billion. Total debt in 2001 was $12.02 bil-
lion. The decrease in 2003 was primarily due to the utilization of cash
flow from operations to pay down existing balances. The increase in
debt in 2002 was primarily driven by the Clairol acquisition.
Long-term borrowing available under the Company’s current shelf reg-
istration statement filed in March 2002 was $3.50 billion at June 30,
2003. Additionally, due to strong credit ratings, the Company is able to
issue commercial paper at favorable rates and to readily access general
bank financing. The Company’s Standard & Poor’s (S&P) and Moody’s
short-term credit ratings are A-1+ and P-1, respectively.
Capital Spending
Capital spending efficiency continues to be a focus area for the Com-
pany. Total capital spending in 2003 was $1.48 billion, a decrease of
$197 million compared to 2002 spending of $1.68 billion. Capital
spending in 2001 was $2.49 billion. Capital spending in 2003 as a
percentage of net sales was 3.4%, the lowest level in over a decade.
Capital spending was 4.2% and 6.3% of net sales in 2002 and 2001,
Financial Condition
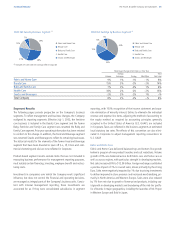
The Company’s financial condition remains solid, particularly as demon-
strated by cash flow generation. One of the Company’s key focus areas
is cash management, including capital spending targets, to achieve
superior shareholder return.
Cash
Operating cash flow provides the primary source of funds to finance
operating needs, capital expenditures and shareholder dividends. This is
supplemented by additional borrowings to provide funds to finance the
share repurchase program and acquisitions. The overall cash position of
the Company reflects a global strategy to optimize cash management
while considering offshore funding needs, liquidity management objec-
tives and other economic considerations.
The Company continues to generate strong operating cash flow. In
2003, operating cash flow was $8.70 billion, up $958 million from
$7.74 billion in 2002. The increase in 2003 was primarily driven by
higher earnings. Changes in working capital also contributed, primarily
behind an increase in current liabilities. Operating cash flow in 2002
was up $1.94 billion from $5.80 billion in 2001, driven by higher earn-
ings as adjusted for lower depreciation and amortization charges, and
an increase in taxes payable.
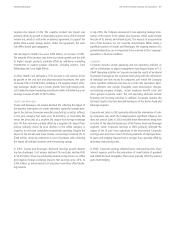
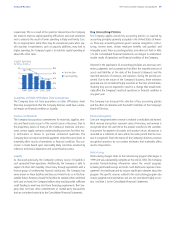
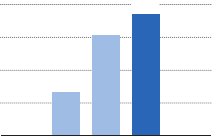
Operating cash flow less capital spending, or free cash flow, was $7.22
billion for 2003, a 19% increase over the prior year. The majority of the
year-over-year improvement was driven by increased earnings with
lower capital spending also contributing. Free cash flow was $6.06
billion in 2002 and $3.32 billion in 2001.
Net cash used for acquisitions in 2003 was $61 million. This compares
to $5.47 billion in cash used in 2002, primarily for the Clairol acquisi-
tion, and $138 million in 2001. The pending acquisition of Wella AG will
be funded using a combination of debt and available cash balances.
3.32
6.06
7.22
Free Cash Flow
(in billions of dollars)
2001 2002 2003