Proctor and Gamble 2003 Annual Report Download - page 50
Download and view the complete annual report
Please find page 50 of the 2003 Proctor and Gamble annual report below. You can navigate through the pages in the report by either clicking on the pages listed below, or by using the keyword search tool below to find specific information within the annual report.-
 1
1 -
2
-
3
-
4
-
5
-
6
-
7
-
8
-
9
-
10
-
11
-
12
-
13
-
14
-
15
-
16
-
17
-
18
-
19
-
20
-
21
-
22
-
23
-
24
-
25
-
26
-
27
-
28
-
29
-
30
-
31
-
32
-
33
-
34
-
35
-
36
-
37
-
38
-
39
-
 40
40 -
 41
41 -
 42
42 -
 43
43 -
 44
44 -
 45
45 -
 46
46 -
 47
47 -
 48
48 -
 49
49 -
 50
50 -
 51
51 -
 52
52 -
 53
53 -
 54
54 -
 55
55 -
 56
56 -
 57
57 -
 58
58 -
 59
59 -
 60
60
 |
 |

48Notes to Consolidated Financial Statements The Procter & Gamble Company and Subsidiaries
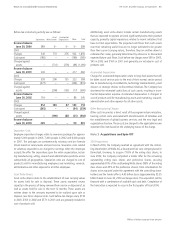
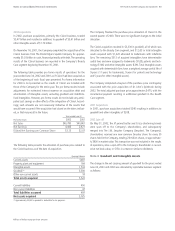
Had the provision of SFAS No. 123 expensing been applied, the Com-
pany’s net earnings and earnings per common share would have been
impacted as summarized in the discussion of the Company’s stock-
based compensation accounting policy in Note 1. In calculating the im-
pact for options granted in 2003 and 2002, the Company has estimat-
ed the fair value of each grant using the Black-Scholes option-pricing
model. The fair value of grants issued in 2001 was estimated using the
binomial options-pricing model. The fair value estimates of these mod-
els is not materially different. Assumptions are evaluated and revised, as
necessary, to reflect market conditions and experience. The following
assumptions were used:
The following table summarizes stock option activity during 2003, 2002
and 2001:
Net earnings and common shares balances used to calculate basic and
diluted net earnings per share were as follows:
Stock-Based Compensation
The Company has a primary stock-based compensation plan under
which stock options are granted annually to key managers and directors
with exercise prices equal to the market price of the underlying shares
on the date of grant. Grants were made under plans approved by
shareholders in 1992 and 2001. Grants issued since September 2002
are vested after three years and have a ten-year life. Grants issued from
July 1998 through August 2002 are vested after three years and have a
fifteen-year life, while grants issued prior to July 1998 are vested after
one year and have a ten-year life. The Company also makes other grants
to employees, for which vesting terms and option lives differ.
Millions of dollars except per share amounts
2001
5.8%
2.0%
26%
9
2003
3.9%
1.8%
20%
8
Options Granted
Interest rate
Dividend yield
Expected volatility
Expected life in years
2002
5.4%
2.2%
20%
12
Years ended June 30
Options in Thousands 2001
82,744
28,400
–
(5,709)
(1,239)
104,196
48,805
27,994
$61.73
62.20
24.77
63.64
49.14
22.45
2003
120,163
17,880
–
(6,952)
(1,292)
129,799
59,101
101,797
$66.68
91.37
38.70
71.50
70.87
21.99
Outstanding, beginning of year
Granted
Jif and Crisco spin-off adjustment
Exercised
Canceled
Outstanding, end of year
Exercisable
Available for grant
Average price
Outstanding, beginning of year
Granted
Exercised
Outstanding, end of year
Exercisable, end of year
Weighted average fair value of
options granted during the year
2002
104,196
25,040
811
(8,149)
(1,735)
120,163
46,332
114,536
$63.64
70.19
29.07
66.68
56.99
21.14
June 30
Net Earnings
Preferred dividends,
net of tax benefit
Net earnings available
to common shareholders
Preferred dividends,
net of tax benefit
Preferred dividend impact
on funding of ESOP
Diluted net earnings
Shares in millions
Basic weighted average
common shares outstanding
Effect of dilutive securities
Conversion of preferred shares (1)
Exercise of stock options (2)
Diluted weighted average
common shares outstanding
2001
$2,922
(121)
2,801
121
(15)
2,907
2001
1,300.3
91.9
13.4
1,405.6
2003
$5,186
(125)
5,061
125
(9)
5,177
2003
1,296.6
85.1
19.6
1,401.3
2002
$4,352
(124)
4,228
124
(12)
4,340
2002
1,297.4
88.8
18.7
1,404.9
Years ended June 30
Years ended June 30
(1) Despite being included currently in diluted net earnings per common share, the actual
conversion to common stock occurs pursuant to the repayment of the ESOP through 2021.
(2) Approximately 33 million in 2003, 36 million in 2002 and 38 million in 2001 of the Com-
pany’s stock options were not included in the diluted net earnings per share calculation be-
cause to do so would have been antidilutive (i.e., the exercise price exceeded market value).