Proctor and Gamble 2003 Annual Report Download - page 26
Download and view the complete annual report
Please find page 26 of the 2003 Proctor and Gamble annual report below. You can navigate through the pages in the report by either clicking on the pages listed below, or by using the keyword search tool below to find specific information within the annual report.-
 1
1 -
2
-
3
-
4
-
5
-
6
-
7
-
8
-
9
-
10
-
11
-
12
-
13
-
14
-
15
-
 16
16 -
 17
17 -
 18
18 -
 19
19 -
 20
20 -
 21
21 -
 22
22 -
 23
23 -
 24
24 -
 25
25 -
 26
26 -
 27
27 -
 28
28 -
 29
29 -
 30
30 -
 31
31 -
 32
32 -
 33
33 -
 34
34 -
 35
35 -
 36
36 -
37
-
38
-
39
-
40
-
41
-
42
-
43
-
44
-
45
-
46
-
47
-
48
-
49
-
50
-
51
-
52
-
53
-
54
-
55
-
56
-
57
-
58
-
59
-
60
 |
 |
Whitestrips and Olay Regenerist. Marketing investments were partially
offset by lower research and administrative costs, reflecting savings
from the Company’s restructuring program.
As a percent of net sales, MRA&O has improved with 2003 down 30
basis points to 30.9%. Marketing expenses as a percentage of net sales
increased 75 basis points due to the marketing investments discussed
in the preceding paragraph as well as other product launches and
brand equity building activities. This was more than offset by lower
research and administrative expenses as a percentage of net sales due
to scale efficiencies and lower restructuring costs. MRA&O was 31.2%
of net sales in 2002 versus 31.6% in 2001, with higher marketing
investments more than offset by lower restructuring costs.
Non-Operating Items
Interest expense was $561 million in 2003, compared to $603 million in
2002 and $794 million in 2001. The decline in interest expense in 2003
was driven by lower interest rates and debt balances. The decline in
2002 versus 2001 was driven by lower interest rates partially offset by
an increase in debt to fund the Clairol acquisition in November 2001.
Other non-operating income, which consists primarily of interest and
investment income and divestitures, contributed $238 million in 2003
compared to $308 million in 2002 and $674 million in 2001. This
decline was driven by significantly lower gains from divestitures and
asset sales in 2003 and 2002 versus 2001, as the Company’s activity to
divest non-strategic brands declined.
The Company’s effective tax rate for 2003 was 31.1%, a reduction of
70 basis points compared to the 2002 rate of 31.8%. The effective tax
rate for 2001 was 36.7%. The decline in the current year was driven
primarily by the country mix impact of foreign operations, as earnings
increased in countries with lower overall tax rates. The declining rate
since 2001 also reflected the impact of lower restructuring charges and
amortization of goodwill and indefinite-lived intangibles prior to the
adoption of Statement of Financial Accounting Standards (SFAS) No.
142, “Goodwill and Other Intangible Assets.”
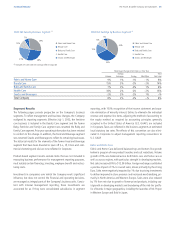
Net Earnings Margins
Net earnings margin was 12.0% in 2003 versus 10.8% in 2002 and
7.4% in 2001. The margin increase in 2003 was primarily driven by
higher volume, lower unit cost of products sold due to lower materials
costs, the benefits of restructuring, as well as base business savings,
and a reduction in restructuring charges. In 2002, the margin increase
reflected a reduction in restructuring charges, the benefit of base and
restructuring cost savings projects on both manufacturing and over-
head costs and the benefits of lower interest expense.
Fiscal year 2002 sales were $40.24 billion, an increase of 3%, com-
pared to $39.24 billion in 2001, on volume growth of 7% driven by
Health Care and Beauty Care. Net sales grew less than volume due to a
1% impact for exchange effects, a 1% impact for pricing and a 2%
impact for mix.
Net Earnings
Net earnings were $5.19 billion in 2003, an increase of 19% compared
to $4.35 billion in 2002. Reported results included after-tax restructur-
ing charges of $538 million in 2003 and $706 million in 2002. In-
creased earnings were driven by volume growth, the shift in mix to
higher profit products in the Health Care and Beauty Care segments,
lower restructuring costs and lower manufacturing costs as a percent-
age of net sales. Net earnings in 2001 were $2.92 billion, including
after-tax restructuring charges of $1.48 billion. Net earnings in 2002
exceeded 2001 due to volume growth, manufacturing savings and
lower restructuring charges. The restructuring program covered enroll-
ment reductions, manufacturing consolidations and portfolio choices to
scale back or discontinue under-performing businesses and initiatives
and was substantially complete at June 30, 2003. It is discussed in
more detail in the Restructuring Program section and Note 2 to the
Consolidated Financial Statements.
Diluted net earnings per share were $3.69 in 2003 compared to $3.09
in 2002 and $2.07 in 2001, including the restructuring charge impact
of $0.39, $0.50 and $1.05 per share, respectively.
Operating Costs
Cost of products sold was $22.14 billion in 2003 compared to $20.99
billion in 2002 and $22.10 billion in 2001. Before-tax restructuring
charges included in cost of products sold were $381 million in 2003,
$508 million in 2002 and $1.14 billion in 2001. Gross margin in 2003
improved to 49.0%, an increase of 120 basis points versus the previous
year. Lower restructuring costs accounted for 40 basis points of the
improvement with the remainder achieved behind lower material
costs and the benefits of restructuring and base business savings
delivered outside the restructuring program. Gross margin of 47.8% in
2002 improved versus 43.7% in 2001, which was more significantly
impacted by restructuring charges.
Marketing, research, administrative and other expense (MRA&O) was
$13.38 billion in 2003 versus $12.57 billion in 2002 and $12.41 billion
in 2001. MRA&O included before-tax restructuring charges of $374
million in 2003, $519 million in 2002 and $583 million in 2001. The
increase in MRA&O in 2003 versus 2002 was driven by additional
marketing investments behind new product launches and expansions
of existing brands, including Tide with Bleach, Swiffer Duster, Crest
The Procter & Gamble Company and Subsidiaries
Financial Review 24